Planning a Turnaround of the Right Size: A Practical Guide to Risk-Based Work Selection (RBWS)

In the refining and petrochemical world, keeping facilities reliable over the long haul is key to running safe and efficient operations. Unplanned outages and safety incidents come with high financial and reputational costs, which is why companies aiming to maximize uptime must take a thoughtful, proactive approach to turnaround planning. Risk-Based Work Selection (RBWS) – also known in the industry as Risk-Based Scope Review (RBSR) – is a structured methodology designed to help organizations prioritize and optimize turnaround work based on actual risk and economic justification, rather than habit or assumption.
RBWS offers a way to tighten worklists, focus resources, and make sure each task adds real value. Based on our experience, organizations that implement this process have the potential to significantly reduce turnaround spending. We’ve seen reductions averaging $7.2 million per review and the elimination of roughly 26% of low-return worklist items. Some sites have even saved more than $100 million in total costs across multiple turnarounds. With returns that can exceed $12,000 for every dollar invested in the review, the upside is substantial.
This article walks through the RBWS process: how it works, what makes it effective, and what teams should consider when preparing for and conducting a review.
RBWS in Context: Asking the Right Questions
RBWS is a structured process for challenging turnaround and maintenance worklists. Rather than assume that every proposed task must be done, the process relies on a clear set of questions to guide decision-making:
- Can the work be done effectively on-stream instead of during the turnaround?
- Does the risk of deferral exceed the health, safety, and environmental (HSE) threshold?
- Is there a strong benefit-to-cost ratio?
- Are the scope and cost clearly defined?
- Will the task address a recurring failure or “bad actor”?
These questions help the team look critically at each item. What seems important on paper may not hold up under scrutiny. On the flip side, a risk that’s been flying under the radar could come to light. By the end of the process, teams are more confident they’re doing the right work for the right reasons.
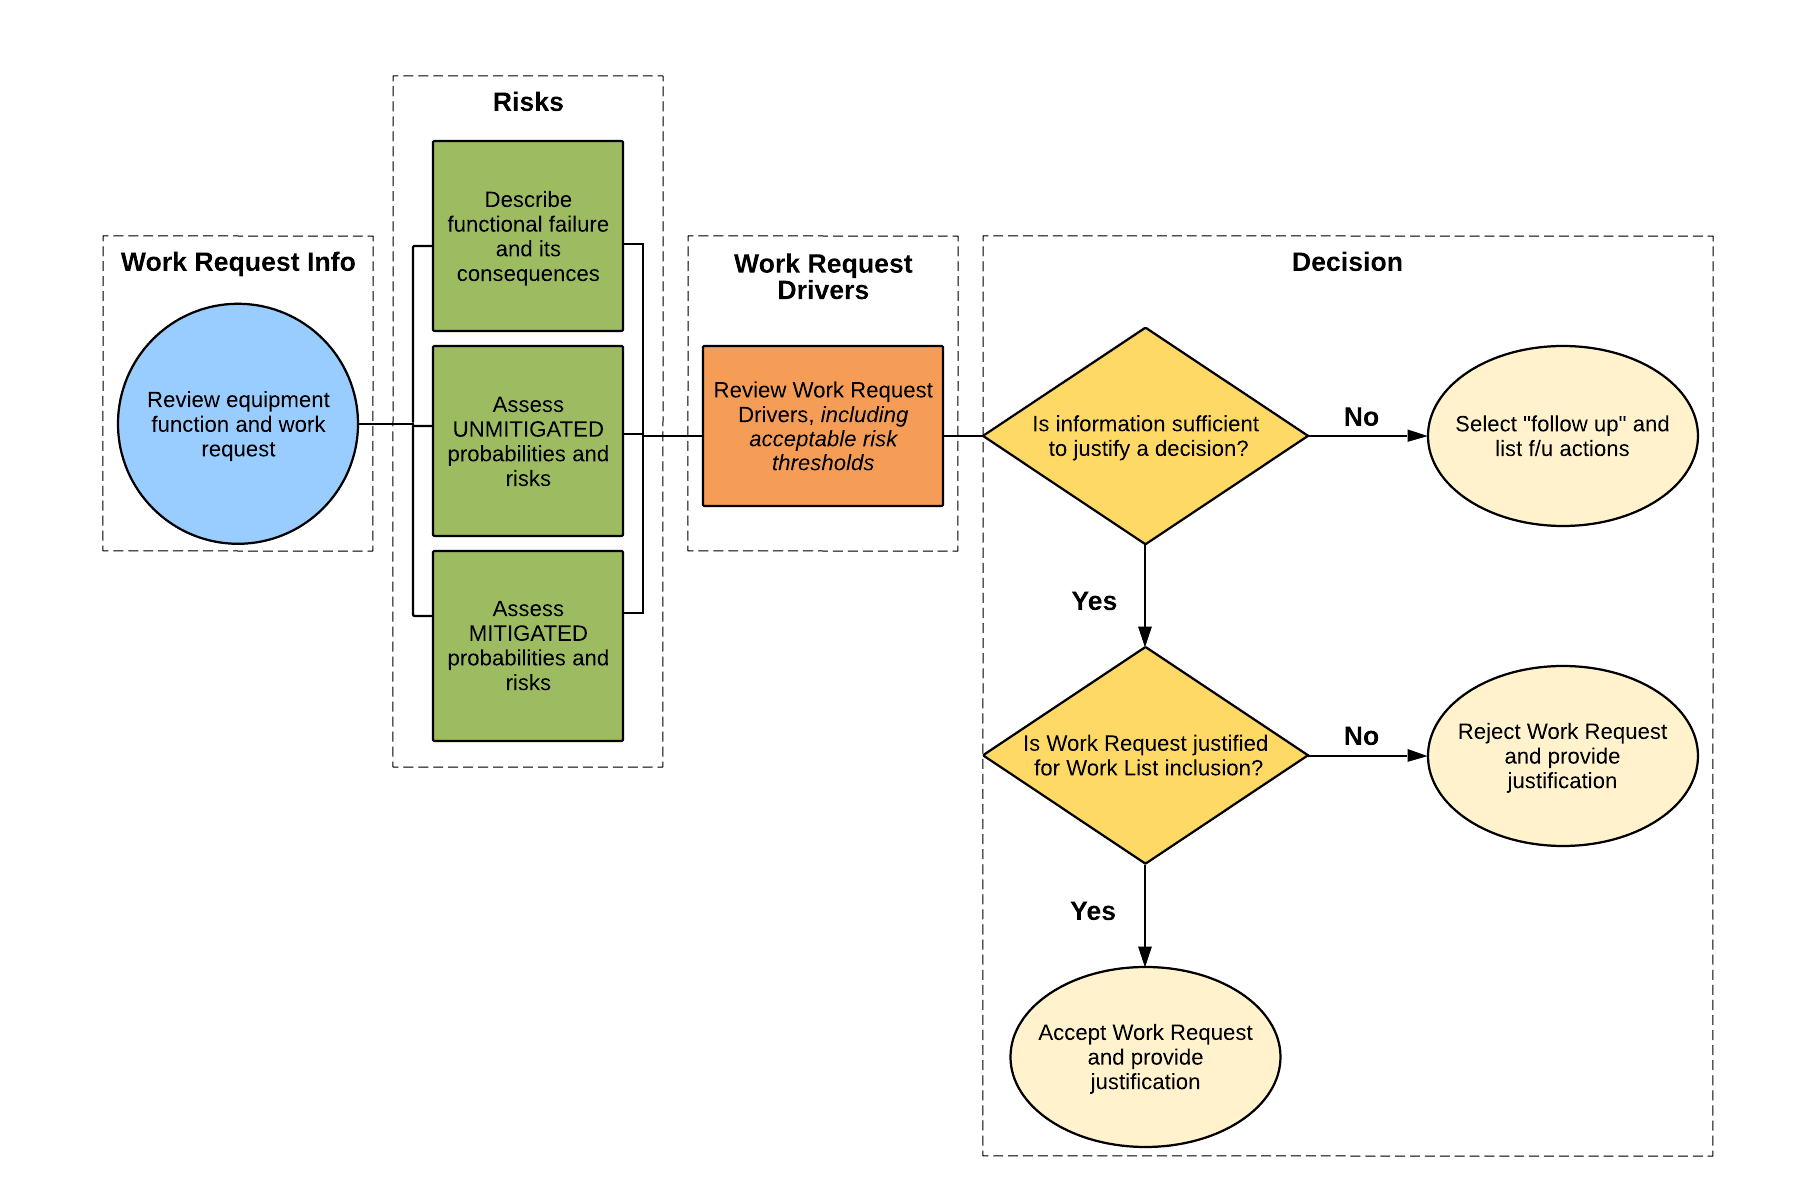
Figure 1: Overview of the Risk-Based Work Selection (RBWS)/Risk-Based Scope Review (RBSR) workflow used to develop and screen turnaround work scopes
Software as a Backbone
While much of the data needed for an RBWS already exists in spreadsheets, maintenance logs, and inspection databases, it’s often scattered and inconsistently formatted. This makes the review process harder than it needs to be.
The ideal RBWS software tool helps bring everything together in a clear, consistent format. It should:
- Document decisions so leadership can understand what’s in or out and why.
- Streamline data gathering by providing clear fields and guidance on what information is needed.
- Support facilitation with a user-friendly interface that makes it easy to view, edit, and discuss worklist items during the review.
- Offer web-based accessibility so teams across sites can collaborate in real time.
- Generate reports that summarize scope decisions and visualize value, such as Benefit-to-Cost curves.
A good tool makes the review go faster, but it also preserves decision rationale for future turnarounds, promotes consistency, and builds institutional knowledge.
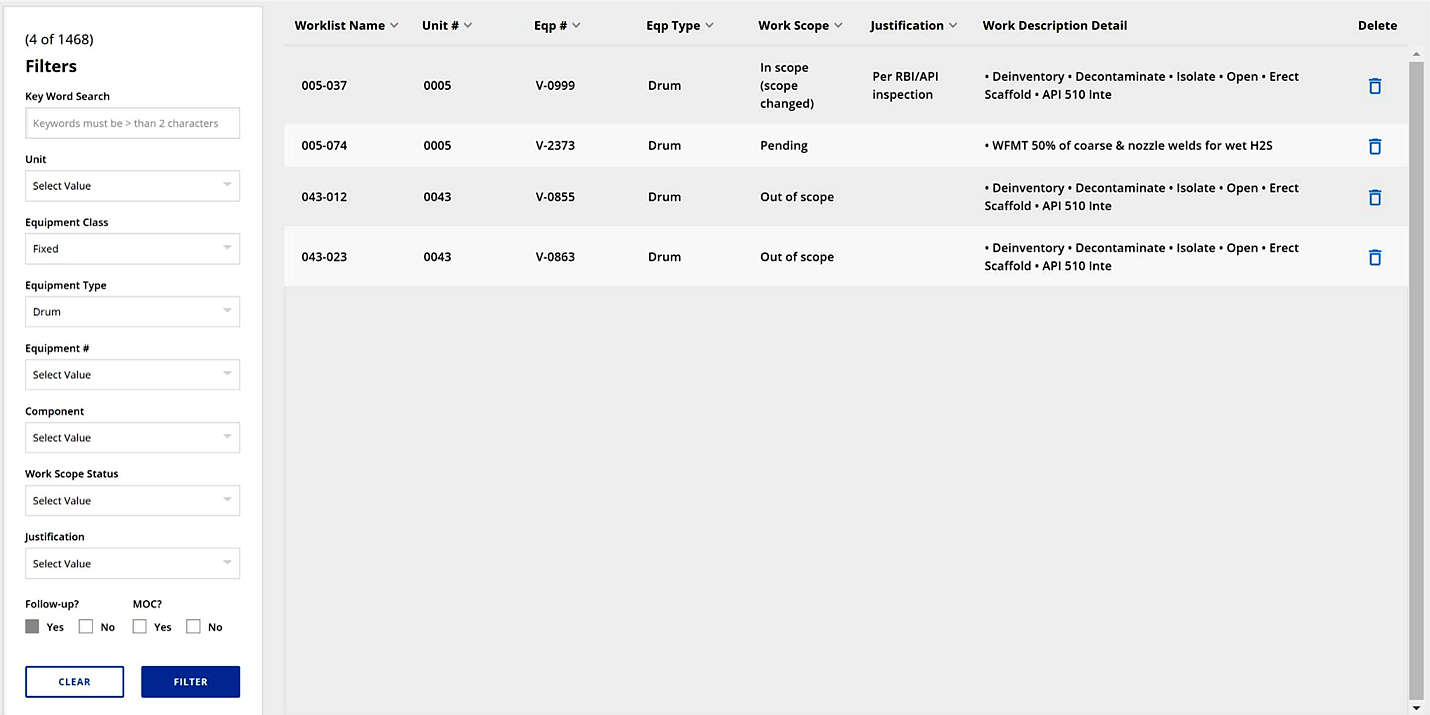
Figure 2: Sample web-based software interface for reviewing, updating, and documenting turnaround worklist items
Preparation: Building a Review-Ready Worklist and Team
A strong RBWS process depends on good preparation. That means having the right data, the right people, and clear expectations going in. Preparation typically involves two parallel efforts: worklist development and stakeholder training.
Preparing the Worklist
Each worklist item should include:
- A task description
- Estimated cost and manhours (with reasonable accuracy, ±30%)
- A clear explanation of what could happen if the work is deferred
For certain tasks, like exchanger cleaning, more detailed information is helpful – such as fouling rates, inspection history, and equipment performance data.
Prescreening is also important. Items that are required by regulation, or those that are very low-cost with obvious benefit, can be marked as in-scope ahead of time. This reduces the number of items to review and keeps the focus on those that need closer examination.
Training the Team
New sites or teams unfamiliar with RBWS typically benefit from training sessions ahead of the review. These sessions align expectations, walk through examples, and clarify what data needs to be submitted. Including key stakeholders (like operations, maintenance, inspection, reliability, and HSE) is critical for a well-rounded discussion.
The success of the review depends on the quality of the input and engagement. Poorly defined worklist items, missing risk descriptions, or vague justifications will slow the review or result in deferrals. Teams should view both worklist preparation and training as investments in planning excellence.
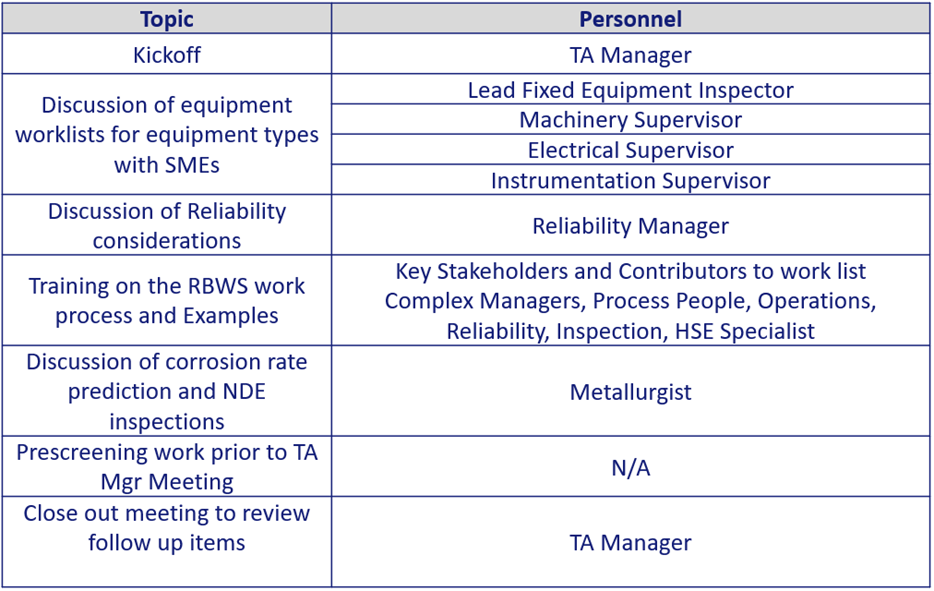
Table 1: Sample structure for preparing a site team
Understanding Risk: Definitions and Calculations
RBWS revolves around risk: specifically, the probability and consequence of failure. The goal is to make this abstract concept tangible so it can be factored into turnaround decisions.
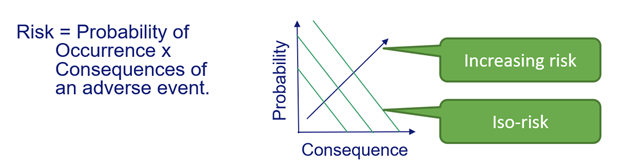
Figure 3: Basic visualization of how probability and consequence interact to define risk levels
Teams should evaluate each item using these core questions:
- What can go wrong? (Including failure modes and escalation scenarios)
- What would happen if it did? (Impact on HSE, operations, or cost)
- How likely is it to occur?
A standardized risk matrix ensures consistent scoring. Most software tools will incorporate this into a calculator that shows both unmitigated and mitigated risk levels. This makes it easier for teams to visualize the value of proposed work—and to identify whether lower-cost mitigations might achieve the same benefit.
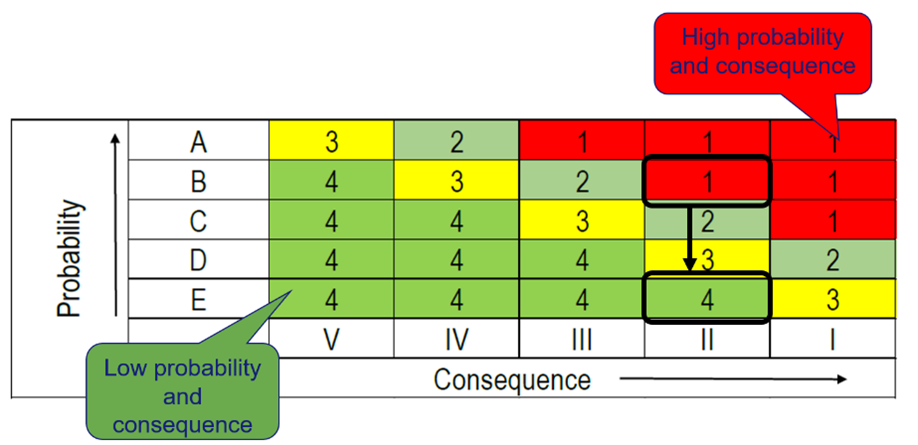
Figure 4: Sample conventional risk matrix
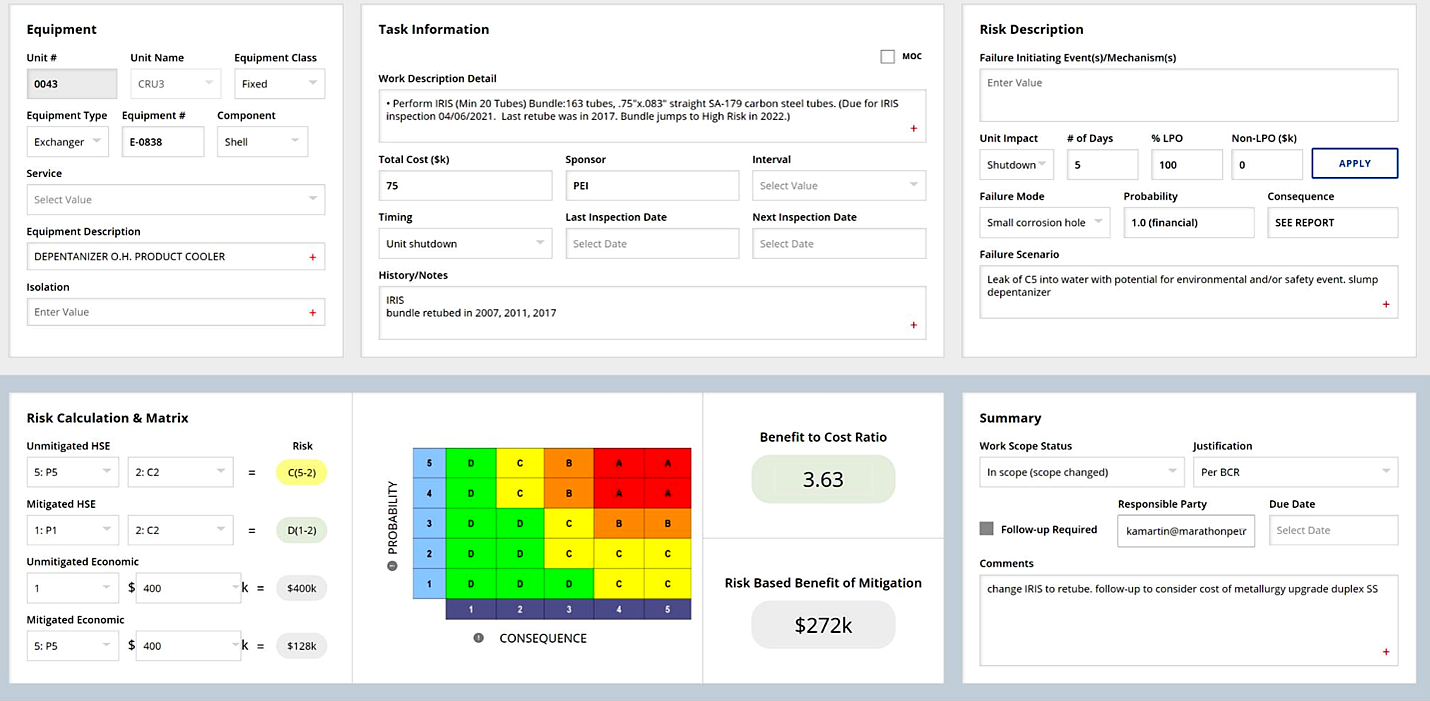
Figure 5: Example of risk calculator interface showing unmitigated and mitigated HSE and economic risks
Economic Justification and Benefit-to-Cost Ratio (BCR)
Beyond safety, economic justification plays a big role in scope decisions. For each discretionary task, teams evaluate how much downtime it could prevent and what that downtime would cost.
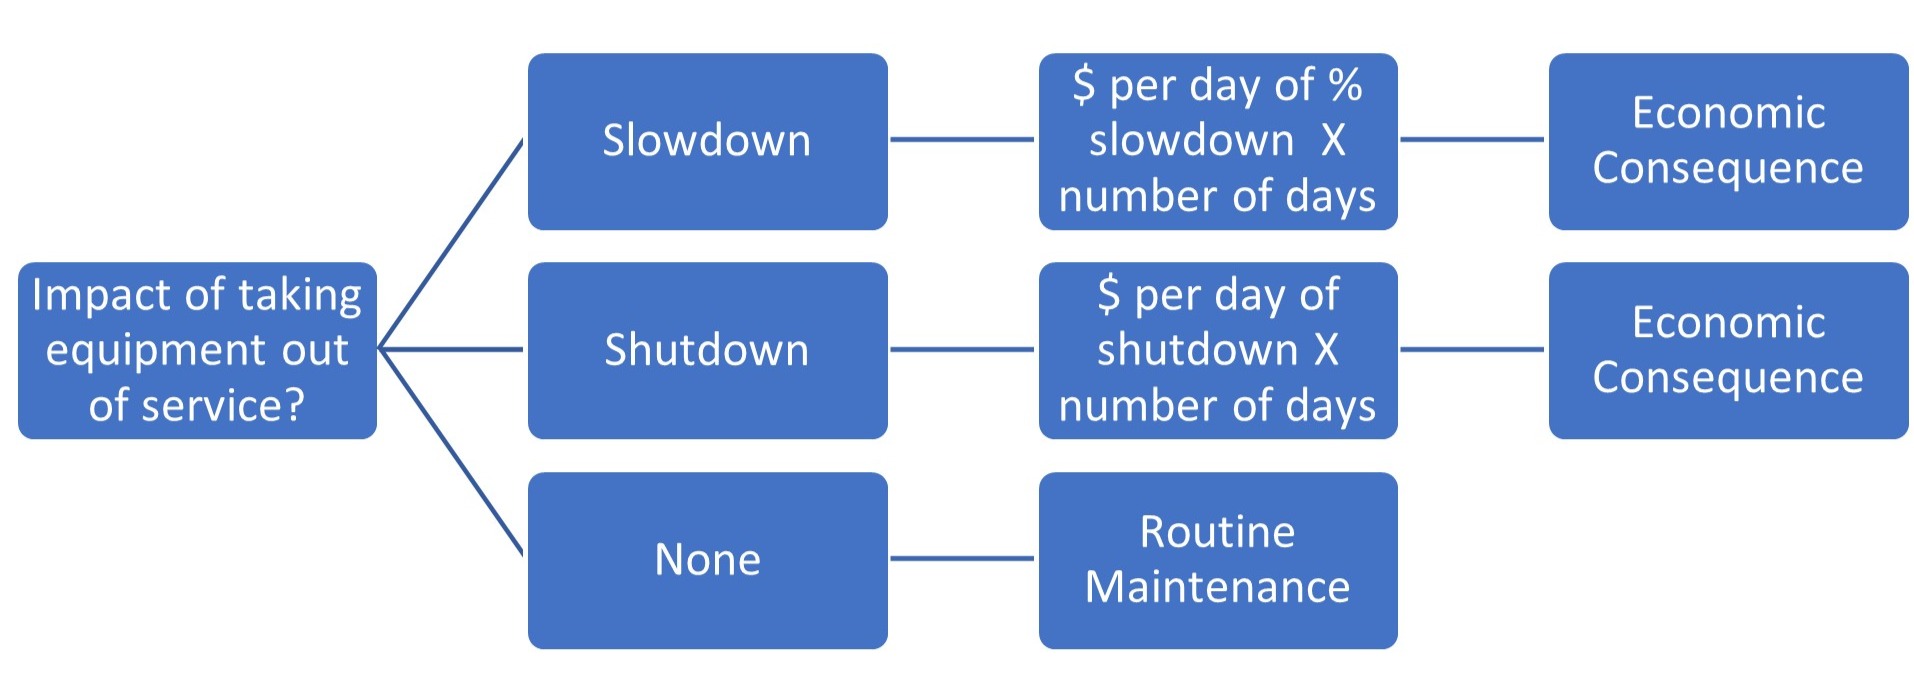
Figure 6: Formulaic approach to estimating the economic consequence of task deferral or failure based on downtime duration
To estimate the economic consequence of failure, a team must consider:
- How long it would take to isolate, inspect, repair, and return the equipment to service
- Whether post-repair steps like heat treating or testing are required
- What the lost production would mean financially
For example, the typical outage duration for a drum is 7 to 10 days of downtime. Meanwhile, a tower could be out for two or three weeks. These kinds of delays add up quickly.
Once the consequence is understood, it’s compared to the cost of doing the work using the following formula:
Benefit-to-Cost Ratio (BCR) = Financial Benefit of Mitigation / Task Cost
If the BCR exceeds the site’s threshold (often 3:1 or 5:1), the task is generally considered justifiable. If not, the team may choose to defer it or explore alternatives.
After BCRs have been calculated for all discretionary items, plotting them in descending order provides another layer of insight. A cumulative Benefit-Cost Curve (Figure 8) helps teams visualize which tasks offer the strongest return on investment, and where that return begins to taper off. Tasks with the highest BCRs appear on the left side of the curve, typically justifying inclusion. As the curve flattens, remaining tasks deliver diminishing returns. This visualization is a powerful aid for final scope decisions, particularly when budget or resource constraints require prioritization.
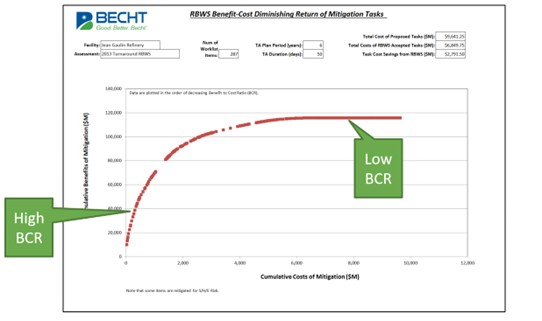
Figure 7: Benefit-Cost Curve showing cumulative cost vs. benefit of mitigation for discretionary tasks
Applying RBWS: Lessons from a Large Turnaround Review
Ahead of a major turnaround involving over 500,000 manhours, one large refinery conducted an RBWS review to optimize scope. After prescreening, 327 worklist items were evaluated by a cross-functional team representing operations, maintenance, reliability, inspection, and HSE.
The team’s evaluation uncovered the following:
- 156 items remained in-scope, totaling $12.1 million
- 158 items were removed, worth $12.7 million
- 13 items were flagged as pending, valued at $1.5 million
A key driver of scope reduction was identifying tasks that could be completed safely during routine operations. In many cases, routine maintenance is far less costly than turnaround execution, making this an attractive alternative. The site’s strong history of inspections helped enable confident decisions to defer or modify work.
The RBWS process also revealed one unit with elevated risk following multiple process upsets in the previous run. This prompted additional planning for inspections and contingencies. In several cases, work that wasn’t fully justified was retained in a modified form, which reduced costs while still addressing key risks.
In total, the one-week review led to substantial savings, reduced risk exposure, and a more defensible, right-sized turnaround plan.
Final Thoughts
Whether your organization calls it Risk-Based Work Selection (RBWS) or Risk-Based Scope Review (RBSR), the core principle is the same: align turnaround scope with true risk and value. RBWS is a structured way to cut through the noise and bring clarity to turnaround planning. It equips teams with the data and discipline to focus on high-impact work while eliminating scope that doesn’t carry its weight.
When done right, RBWS leads to safer operations and better use of resources. It builds alignment across functions, supports transparent decision-making, and creates a roadmap that leadership can stand behind.
If you’re looking to improve turnaround performance and reduce spend without increasing risk, RBWS is a proven path worth exploring. To discuss how it could be applied at your site, contact Becht to start the conversation.
Like what you just read? Join our email list for more expert insights and industry updates.