Recent Advances in Becht’s HTHA Damage Modeling Approach- Part 3: C-0.5Mo Dataset and Calibration
Overview
Part 2 of this series presented the extension of our model to C-0.5Mo material and calibration to very detailed through-wall damage data for five C-0.5Mo cases (from [1]). This part completes the analysis of C-0.5Mo by including data from API RP 941 [2] (including both plotted and file points) and the remaining cases from the Lui thesis [1].
The results are a collection of calibrated carbon activities (ac) required for the model to match the damage extent for the given time. These carbon activities are presented and characterized statistically such that average and minimum C-0.5Mo Nelson Curves can be constructed based on actual industry performance.
Available Operating Case History Data
Substantial data exists for long-term operating performance of C-0.5Mo steels, with the data in API RP 941 [2] and it’s basis document [3] representing a substantial expert-reviewed compilation. While detailed background files exist for many of the points, sometimes significant uncertainties remain for many cases as well. After extensive review, 31 points from [2] were found to have enough information, when supplemented with reasonable and generally conservative assumptions, to attempt a through-wall damage calibration. When combined with the data and case histories in [1] (termed “MPC” cases for convenience) 40 distinct points are available for study.
The make-up of the data set in terms of temperature, hydrogen partial pressure and operating duration is shown in Figure 1 and Figure 2. The figures break up the available cases into:
- Base Metal (remote from weld/no weld residual stress influence): 15 points
- PWHT (near weld, PWHT-level weld residual stresses): 18 points
- As-Welded (weld region, full weld residual stresses): 7 points
The level of damage ranges from none (4 points) to through-wall failure with durations from 2 to 32 years. The no attack cases are a subset of those available that target long times and a coverage of temperature and pressure where damage might actually be expected; that is, cases showing no attack for short times or where damage is exceptionally unlikely (or both) are of limited value from a calibration standpoint. For the data set as a whole there is good coverage of temperature and pressure, with a fairly uniform distribution of times as well (that is, for a given temperature there is a range of operating durations). Each of these 40 points is thoroughly reviewed and characterized as part of the calibration, which uses the procedure described in the next section.
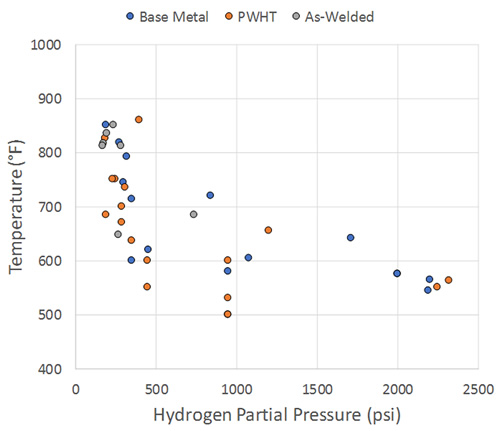
Figure 1: Temperature-Partial Pressure Make-Up of Data
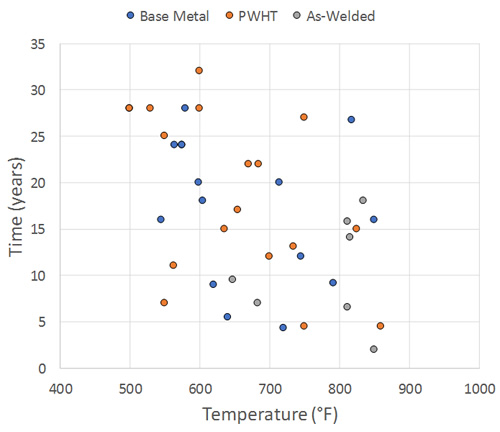
Figure 2: Temperature-Time Make-Up of Data
Calibration Procedure
As discussed in the last section, calibration is based on as-welded, PWHT and base metal conditions, which correspond to different WRS levels (100%, 30% and 0%, respectively) and for the as-welded case, an increased dislocation density in the low temperature creep term. From review of the background data, all as-welded failures were crack-like and occurred in the weldment region (typically the HAZ). An example of such is case is shown in Figure 3. Interestingly, a number of PWHT failures also occurred in HAZ and were crack-like; API RP 941 points 27, 39, 46 and 62 as well as file points 13, 15 and 17 are likely examples. For the remaining 11 (out of 18) PWHT cases the damage was noted as being well away from welds, and for these cases 0% WRS was assumed.
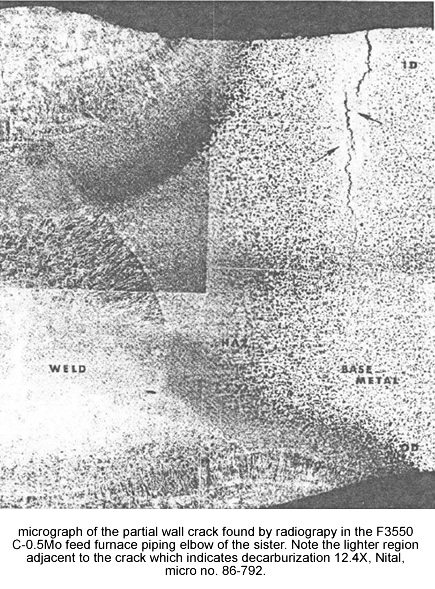
(from API RP 941 C-0.5Mo Plotted Point 58 Background Information)
Figure 3: Example of Local Crack-Like Damage
Regardless of WRS level, unless detailed information was available the stress level in the wall was assumed to be at 100% of the allowable. The allowable stress and yield strength correspond to the actual specification (e.g. SA-204 Gr. A, B, C, SA-335 P1, etc.) and depend on temperature as described in a previous part of this series. Also recall that the WRS is taken as yield at the given temperature plus 10 ksi. For temperatures greater than 800°F, as-welded WRS values are taken as 85% of this value.
While the majority of cases have detailed information available, for some cases it was not clear if the damage location is near a weld or not. For these cases, a conservative first pass was to assume the damage was well away from any welds (0% WRS). If this result could not reasonably bound the behavior, then PWHT (30% WRS) was assumed.
Also note that several failures were through-wall, and for these cases a failure criterion is needed. This criterion can actually be considered to be part of the calibration process, though in this case the initial criteria selected worked quite well. Specifically, for crack-like damage cases, through-wall failure is taken as 100% damage to 25% of the wall. For purely volumetric damage away from any welds, a criterion of 100% damage to 50% of the wall was assumed, which is likely quite conservative. This is not necessarily intuitive, but in the absence of any through-wall WRS, the methane pressure-based driving force falls off substantially through wall and forcing 100% damage to propagate to mid-wall gives higher predicted activities. This is because for the parabolic decrease in pressure, the mid-wall location has only (1 – 0.5)2 = 25% of the surface pressure, but is still required to achieve 100% damage. While these simple criteria were selected to be physically reasonable, the justification for them is empirical in that they were ultimately qualified by the ability to match known failures.
Calibration Examples
The first example is taken from [1] to illustrate the benefit of differentiating between different degrees of damage. MPC-18 was studied extensively in [1] and was a focus of the last part of this series. It so happens that MPC-21, although from a different heat exchanger and operator, also operated at 950 psi hydrogen partial pressure and had “damage”, although at a temperature 50°F less than MPC-18.
If one takes the approach that any damage is “bad” and degree of damage can be ignored, then MPC-21 was by far the worse material since it suffered damage in the same time at a much lower temperature. Use of the word “much” is intentional, since the old rule of thumb that every 25°F cuts the creep life in half reasonably applies to HTHA as well. By that logic MPC-21 should’ve lasted 4 times longer than MPC-18 if the materials had equal HTHA resistance. In reality, MPC-18 had gross damage far into the wall, while MPC-21 was found to have less than 2% of grain boundary length damaged (limited to isolated methane voids) at the surface only.
This difference is illustrated quantitatively (on a damage basis) in Figure 4; this figure shows that a much different conclusion is possible about the better material. In fact, an ac of 0.5 is obtained for MPC-21 to match the observed damage, while MPC-18 had an ac of 0.635. To illustrate the impact of these different carbon activity values, the predicted through wall damage for the MPC-21 conditions are shown in Figure 5 for both ac values (0.5 and 0.635). As shown, the result is to take almost no bulk damage and change it to 100% damage through a substantial portion of the wall.
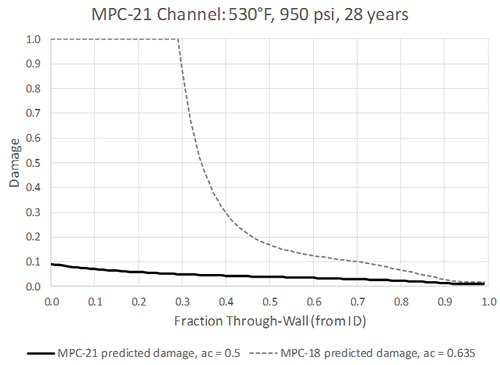
Figure 4: Predicted Through-Wall Damage for MPC-21
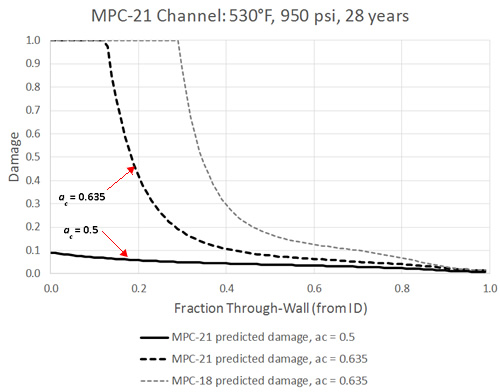
Figure 5: Predicted Through-Wall Damage for MPC-21 – ac Effect
The next calibration example is for a case that showed no damage. The longest “no attack” case available is MPC-16 which operated at 600°F and 450 psi hydrogen partial pressure for 32 years. Here no attack is assumed to correspond to some small level of surface damage that would not be detected by traditional non-destructive examination (NDE). Figure 6 shows 3 different damage scenarios; 10%, 25% and 50%, which are maximum values at the exposed surface. The results are presented in Nelson Curve form for 32 years, and as shown ac’s of 0.41, 0.48 and 0.50 are predicted for the different damage levels, respectively. Some amount of judgement is required in selecting these values, with the goal of tending towards a conservative value. In the work presented here, generally a “no attack” surface damage of 25% is used for well-documented or more modern cases, while 50% (local fissuring threshold) is used for older cases. For MPC-16 this means that an ac of 0.48 is taken as the final calibration result.
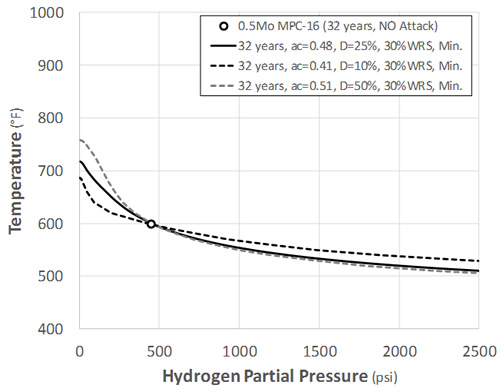
Figure 6: MPC-16 Carbon Activity for Different Damage Assumptions
Results
The overall results of the calibration can be presented in terms of the ac’s obtained for each of the 40 cases, which is given in Figure 7. Of note is that there is an approximately normal distribution of carbon activities centered on ac = 0.6, and that there are 2 outliers with an ac = 1, which corresponds to carbon steel. The outliers are for API RP 941 plotted points 45 and 46, which are described in detail in reference [4]. Point 45 (hot formed heat exchanger head) suffered severe damage found by traditional NDE after 9 years at a temperature of 620°F and a hydrogen partial pressure of 457 psi. Point 46 (long seam welded pipe) is similar with severe damage after 15 years at 626-680°F and 350 psi. In both cases the performance is as bad as the worst-performing carbon steels despite good Carbon and Molybdenum content. It’s true that [2] is a key reference illustrating the importance of heat treatment in stable carbide development; however, as no other cases are known with performance anywhere near as poor as Points 45 and 46 (even when stable carbides are found to be an issue), it’s assumed that gross fabrication errors were made that are not representative of industry.
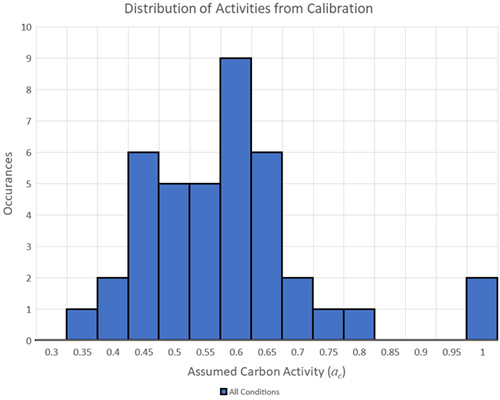
Figure 7: Carbon Activity Summary from Calibration
The resulting best fit normal distribution with the two outliers removed is shown in Figure 8. The distribution has a mean carbon activity value of 0.55 and a standard deviation of 0.103. An ac of 0.72 captures 95% of the data while an ac of 0.75 captures 97.5%. Figure 9 shows the calibrated carbon activities vs. operating temperature and as shown, there does not appear to be a bias for any of the conditions.
With reference to Figure 5, the difference between the mean (0.55) and -2*sigma (0.75) results represents a significant variation in expected life, or in allowed temperature for a given partial pressure and time. However, this wide range in performance is not unexpected when looking at the data in generic Nelson Curve format (as in Figure 4 of Part 2 of this series, reproduced in this part as Figure 10). While consideration of condition (base metal, PWHT or as-welded) and operating duration rationalizes a substantial amount of variability, the results in Figure 8 demonstrate that significant variability in performance remains. This makes relating critical factors such as Mo/C ratio and fabrication variables important to predicting where a given component’s performance will fall within the scatter band, which has always been a strength of the Becht method [5].
From a general assessment behavior perspective, the mean and -2*sigma provide a useful basis for generating time-based Nelson Curves, which are provided in the last part of this series for both C-0.5Mo and carbon steel. Presentation of the carbon steel data analysis is presented first, which is the subject of the next part.
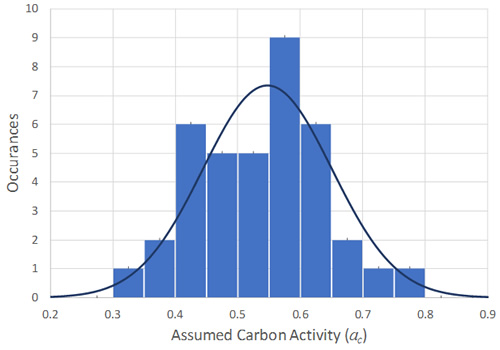
Figure 8: Carbon Activity Calibration Results and Corresponding Normal Distribution
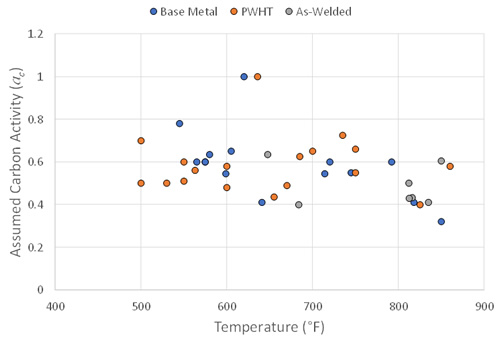
Figure 9: Carbon Activity Calibration Results – Temperature Bias Check
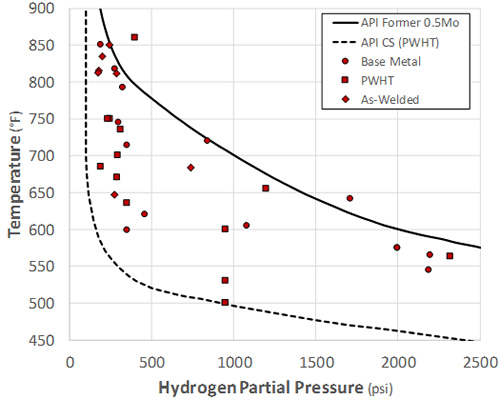
Figure 10: C-0.5Mo API RP 941 and MPC Failure Points
Summary
This blog has presented analysis of forty C-0.5Mo industry data points in terms of calibrated carbon activity (ac). As expected, wide variability in performance is found with average behavior corresponding to 0.55 and a value of 0.75 capturing 97.5% of the data (-2*sigma result). The top 2.5% of the data corresponds to an ac of 0.34 for a range of 0.34 to 0.75. This compares well with the anecdotal expected range of 0.5 to 0.8 given in [3]. This analysis provides a solid foundation to generate time based Nelson Curves from, which are given after first presenting the Carbon Steel analysis in the next part of this series.
References
- Peng Liu, “Fundamental Studies of Hydrogen Attack in C-0.5Mo Steel and Weldments Applied in Petroleum and Petrochemical Industries,” in Department of Material Science and Engineering, 2001, The University of Tennessee (Doctoral Dissertation).
- API Recommended Practice 941, “Steels for Hydrogen Service at Elevated Temperatures and Pressures in Petroleum Refineries and Petrochemical Plants,” Eighth Edition, February 2016. The American Petroleum Institute.
- API Technical Report 941-A, “The Technical Basis Document for API RP 941,” Addendum 1, June 2019. The American Petroleum Institute.
- Ishil, K., K. Maeda, R. Chiba and K. Ohnishi, “Intergranular Cracking of C-0.5Mo Steel in a Hydrogen Environment at Elevated Temperatures and Pressures,” 1984 Proceedings, Refining Department, Vol. 63, API, Washington, DC, pp. 55–64.
- Buchheim, G. “A new practical method for prioritizing equipment in HTHA service for inspection and replacement and the challenges in obtaining process conditions to be used in the HTHA Assessment,” Inspectioneering, V(20)-6. November/December 2014.
To gain more insight into this process or request information, please contact Gerrit Buchheim in the Corrosion and Materials (Pono) Group by clicking below:


