“Speed Kills” – An Empirical Association of Antifriction Bearing Behavior When Things Go From Bad to Worse
Machinery and reliability people have for a long time observed that when it comes to long life and high reliability, operating at higher speeds compares poorly to operation at lower speeds.
One of the primary reasons for having high-speed devices is economics. With high speed you can have smaller equipment sizes with fewer stages. While capacity and pressures developed do improve, this often occurs at the cost of increased wear, vibration, noise and maintenance.
There are some limits as to how fast and large we can practically go. At some point even the required lubrication systems become very complex. While smaller equipment can use antifriction/rolling element bearings, their application is typically limited by manufactures to a certain speed. When combined with the bearing size, this limit becomes known as a DN number limit, a product of the mean bearing diameter (ID+OD in mm divided by 2) and the RPM. This DN limit is typically 500,000 (API 610). Equipment that would operate above this limit would typically be supplied with a hydrodynamic or hydrostatic fluid film bearings with possibly quite a complex and expensive forced lubrication skid.
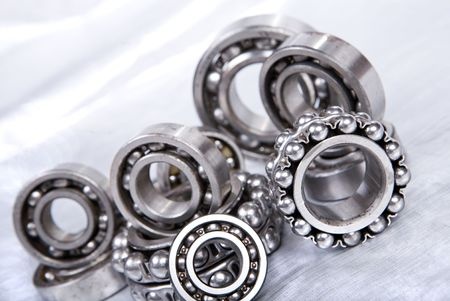
With proper application, operation and maintenance, the majority of ball bearings in the industry operate trouble free. Yet there are occasional incidences, where these bearings fail catastrophically, resulting in significant equipment damage, sometimes resulting in a fire.
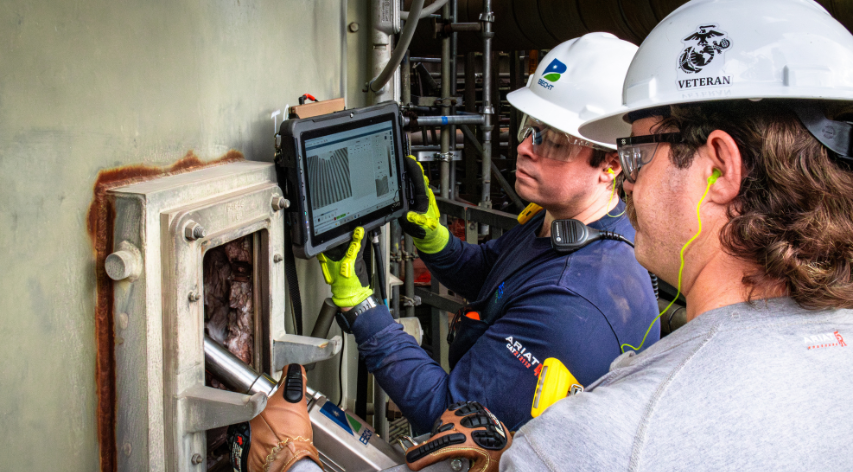
Many programs to prevent such catastrophic failures through periodic manual vibration checks for early detection of failures have been implemented. And yet these periodic vibration checks still miss some failures.
We now have around 50 years of antifriction bearing vibration data. At events such as Turbomachinery Symposia, Vibration Institute Meetings, and Reliability Networks a discussion and a correlation is starting to develop to explain such “misses”. The discussion centers around speed and bearing DN.
As we approach the 500,000 DN mark, things do not magically break down. Things become more critical; centrifugal forces on the rolling elements increase, friction increases and the oil film becomes thinner. Fatigue cycles occur faster with faster RPM. The time interval to respond to preliminary bearing defects becomes shorter as well.
The reliability people have a time related concept called the P-F interval. Simplified, this is the amount of time it takes for an item to progress from a detectable Potential failure symptom (such as overall vibration, spike energy vibration, envelope vibration, or temperature) to a Functional failure (failure of bearing to carry a load). Once this P-F interval is known, we can then settle on a suitable vibration or temperature monitoring method, and monitoring interval (typically half of the P-F interval) and rest assured that a “majority” of faults will be detected before they become a problem.
The issue now becomes that of identifying a suitable P-F interval. A one size fits all approach is simply not adequate. We must recognize the influence of the DN factor on the P-F interval as applied to ball bearings. Note that at this point the discussion will shift solely to ball bearings, a subset of antifriction bearings. While a similar P-F interval correlation may exist for other antifriction (roller and tapered roller) sufficient data is not available at this time.
Let’s examine the following chart:

This chart illustrates that as the bearing size and speed increase, the time from the first sign of distress (such as noise, heat, torque, or vibration) decreases. This correlation appears to hold true for properly applied grease, oil sump, purge oil mist, and pure oil mist lubrication methods. Moreover the P-F time interval decrease is roughly logarithmic in nature. So, if you are doing monthly vibration rounds on a very high DN bearing, you may not be able to catch an incipient failure in time to prevent a catastrophic final failure. At some point only a real time bearing monitoring system may be fast enough.
How was the chart developed?
The two end points of the above plot are best examples. A small ANSI type pump with a two inch shaft operating at 3600 rpm will have a DN of 288,000. Such a pump when correctly designed, maintained and operated may have a MTBR of 150 months or greater. It is quite common for such a pump to give plenty of advanced warning from when the bearings go into distress until final failure. It may operate for months while making a noise and vibrating excessively before failure. This is the ideal candidate for so called monthly manual vibration rounds (inspection at half of P-F interval). Hence the left point on the chart becomes our baseline of 288,000 and 60 days (or 86,000 minutes).
The other end of the line on the right hand side is based on the API 610 recommended upper limit for rolling element bearing not to exceed DN of 500,000. This is a large bearing (7317, 6220) operating at 3600 rpm, or a smaller bearing operating at higher speeds. Bearing designers and major universities have run tests (per discussion groups at Texas A&M Turbo Symposium) on such bearings where lubrication induced problems resulted in total failures ranging in as little as 11 to as much as 180 minutes). Hence the right point on the line becomes approximated as 30 minutes at a 500,000 DN.
Between the two extremes of the line is a curve fit gathered from observing about a dozen catastrophic bearing failures where some information regarding operation prior to failure was known. This P–F time counter was started when either an operator noted a noise from the bearing, an unusual vibration, or subsequent vibration spectrum analysis revealed an anomaly at bearing frequencies. The counter was stopped when all flow from the pump stopped, the shaft seized, or there was a fire. The analysis of this data revealed that there is a good correlation between the DN and the time from first distress sign to the time of failure, but only if the time to failure was plotted on a logarithmic scale. (The time axis becomes a power law or an exponential function of the DN number).
What are the field implications of this correlation?
With DN above 275,000 it becomes impractical to rely on monthly manual vibration checks to early detect failures. While low DN bearings still may fail rapidly (but rapid failure is uncommon), high DN bearings are most likely to deteriorate in a much shorter time interval.
The time to failure for a high DN bearing from a fault inception, could be lubrication, load, or age related. This correlation is meant to point out that there is a relationship with bearing DN and the time interval in which a failure progresses.
Increased vigilance (possibly real time monitoring) is recommended for high DN antifriction bearings. A recommended monitoring strategy is as follows:
|
DN
|
Operation
|
| <300,000 | Normal, monthly vibration checks |
| 300-400,000 | Evaluate monitoring frequency based on flammability, MTBR history, proximity to ignition sources, safety health and environmental, as well as financial loss risk factors |
| >400,000 | Real time vibration monitoring recommended |
| >500,000 | Hydrostatic, hydrodynamic or magnetic bearings |
How does this relate to L10 bearing life?
While the L10 calculation: L10=(C/P)n
Where L10=Millions of revolutions C = load rating P = Load n = 3 for ball bearings
Is only dependent on the relative load carrying capability vs the actual load of the bearing. If the speed is constant it is sometimes shown as
L10h=10 / 60n * L10 L10h = operating hours, n = rpm
Therefore the L10 calculation shows a linear function of life to speed, and predicts longevity based on ratio of actual to rated load.
Note that the DN# vs P-F interval correlation is based on a properly applied and sized bearing and not failures induced or precipitated by a gross design error. On the other hand the correlation IS meant to point out the influence of high DN# on how rapidly ball bearings may deteriorate under field induced problems such as severe process upsets, excessive unbalance or misalignment, low/high oil levels, disturbance in oil mist supply and lubrication contamination.
References:
BREAKING THE CYCLE OF PUMP REPAIRS Heinz P. Bloch, P.E. Buddy Lee Proceedings of the Forty-First Turbomachinery Symposium Copyright © 2012 by Turbomachinery Laboratory, Texas A&M University
McNally Institute (pumping systems consultant) “When do you go from anti-friction ball and roller bearings to hydrodynamic (sleeve) bearings in a centrifugal pump?”
API 610 8th and newer editions: Chapter 2.9 Table 2-7 Bearing selection
Specification CT841 – 2012 Standard for Petroleum and Chemical Industry Definite Purpose, Severe Duty, Totally Enclosed Air Over (TEAO) Permanent Magnet Synchronous
Cooling Tower Direct Drive Motors Up to and Including 370 kW (500 hp)