Vortex Shedding in a Tee with a Closed Branch
Vortex shedding is a flow-induced phenomenon that takes place when there is a structural element in the flow path, such as a closed branch or a thermowell. Vortex shedding leads to an oscillating flow. Depending on the flow conditions, if the frequency of vortex shedding is close to the natural frequencies of the flow system, flow-induced vibration may occur which may lead to significant damages to piping systems or devices in a piping system.
In this blog, vortex shedding will be analyzed using computational fluid dynamics in two tees with a closed branch. The first example shows that vortex shedding takes place at a distinct dominant frequency, which persists in the entire flow system. The second example also indicates vortex shedding, but the oscillating flow only occurs in the closed branch and is overwhelmed by the turbulent flow in the main pipe.
Figure 1 shows the geometry and flow conditions for the tee with a closed branch. Two branch sizes are used: one is 3’’ Sch 40 and the other is 1.5’’ Sch 40. The main pipe is 6’’ Sch 40. The pipe length is 15 times the pipe ID. The branch is located at 8 times the main pipe ID downstream of the pipe inlet. The branch end is closed. The branch length is slightly more than 12’’. Pressure signals are sampled at two locations, as shown in the figure. The mesh density at the model inlet is also shown in the figure. The mesh density is about the same along the axis of the main pipe. Fine cells are used near the wall to capture the large velocity gradients in the wall region. Turbulence is simulated using a hybrid turbulence model – the stress-blending eddy simulation (SBES) model which is a hybrid model with the near-wall region modeled using a Reynolds-averaged Navier-Stokes turbulence model and the center region using a large eddy simulation model.
Figure 2 depicts the pressure fluctuations at the two sampling locations for the branch with a 3’’ diameter. At the beginning of the simulation, the pressure oscillates with small amplitudes. However, as time progresses, the pressure oscillations start to intensify, and the pressure oscillates periodically with large amplitudes compared to the dynamic pressure. The amplitudes of the pressure oscillations at the end of the branch are approximately 3.5 times the amplitudes for the point near the entrance to the branch.
Figure 3 shows the power spectral density (PSD) of the pressure fluctuations presented in Figure 2. The PSD is obtained through a fast Fourier transform of the pressure signals to find the frequencies of the oscillations. For both locations, the dominant frequency is about 232 Hz which corresponds to a Strouhal number of 0.36. However, the peak of the PSD for Location 1 is significantly higher than that for Location 2. For the tee geometry with the flow conditions as shown in Figure 1, the first-mode resonance frequency can be easily calculated to be 257 Hz, corresponding to a Strouhal number of 0.40. Therefore, the frequency of vortex shedding is within ±20% of the acoustic natural frequency of the flow system. To avoid an acoustic resonance of vortex shedding with the flow system, Energy Institute (2008) recommends that the difference between the frequency of vortex shedding and the natural frequency of the flow system should be more than 20%.
Figure 4 illustrates the pressure fluctuations for the case with a branch diameter of 1.5’’. In this case, the branch pipe is 1.5’’ Sch 40 and all other conditions are the same as in the previous case. The dynamic pressure is still 1500 Pa, but the amplitudes of the pressure fluctuations for the two locations are similar and are much smaller than the dynamic pressure.
Figure 5 shows the PSD of the pressure signals provided in Figure 4. For Location 1 (at the end of the branch), the dominant frequency is 247 Hz. There is a second dominant frequency at 282 Hz. The corresponding Strouhal numbers for two dominant frequencies are 0.20 and 0.23. The first-mode resonance frequency for this case can be calculated to be 269 Hz, corresponding to a Strouhal number of 0.22. Note that the frequency of vortex shedding is also within ±20% of the natural frequency of the flow system in this case. For Location 2, there is no dominant frequency. The pressure oscillates at broadband frequencies. The pressure oscillations due to vortex shedding are inundated by the turbulence in the main pipe.
It has been reported in the literature that when the Strouhal number is in the range of 0.3 to 0.6, the resonance between the branch acoustic response and vortex shedding is amplified, causing large pressure fluctuations. The above results demonstrate that when the Strouhal number is around 0.40, resonance occurs, while when the Strouhal number is 0.22, resonance does not take place. In summary, for a straight pipe with a closed branch, for vortex-induced vibration (VIV) to occur, two conditions must be satisfied: the first one is that the frequency of vortex shedding should be close to the frequency of acoustic response and the second condition is that the Strouhal number needs to be in the range of 0.3 to 0.6.
The results discussed above indicate that CFD modeling is a useful tool to determine if acoustic resonance is likely to take place in a flow system.
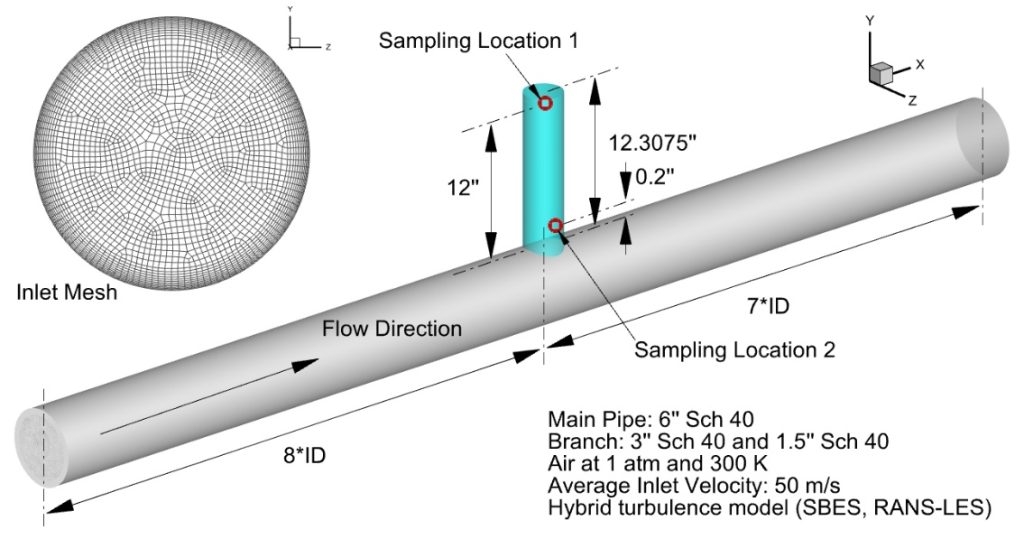
Figure 1. Tee with a Closed Branch.
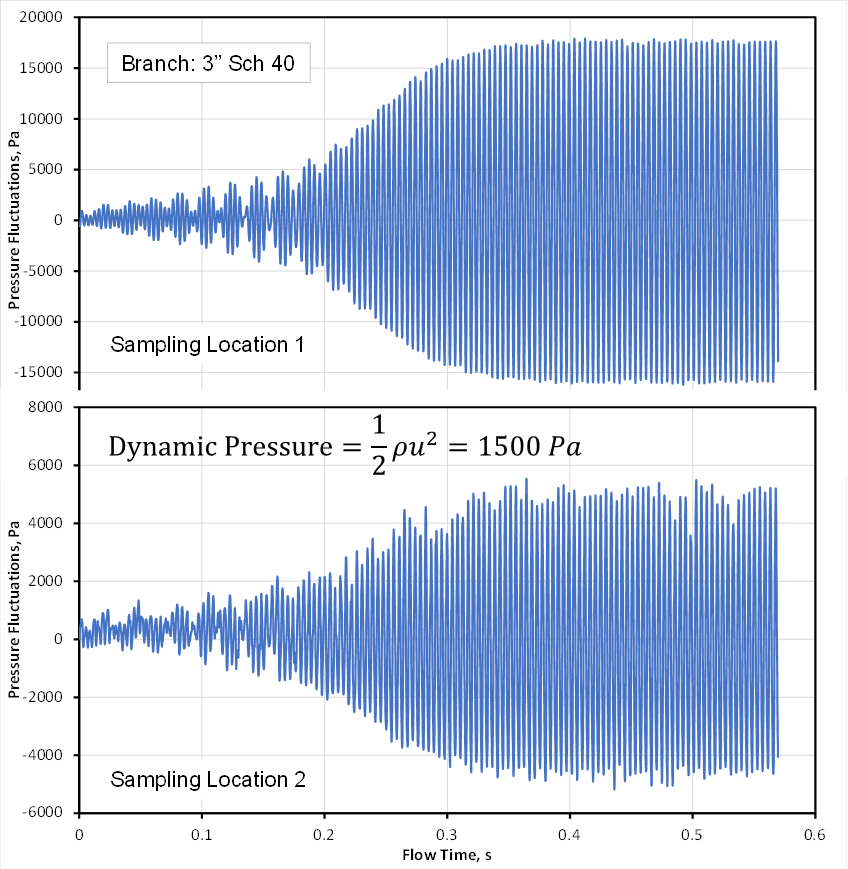
Figure 2. Pressure Fluctuations – 3’’ Branch.
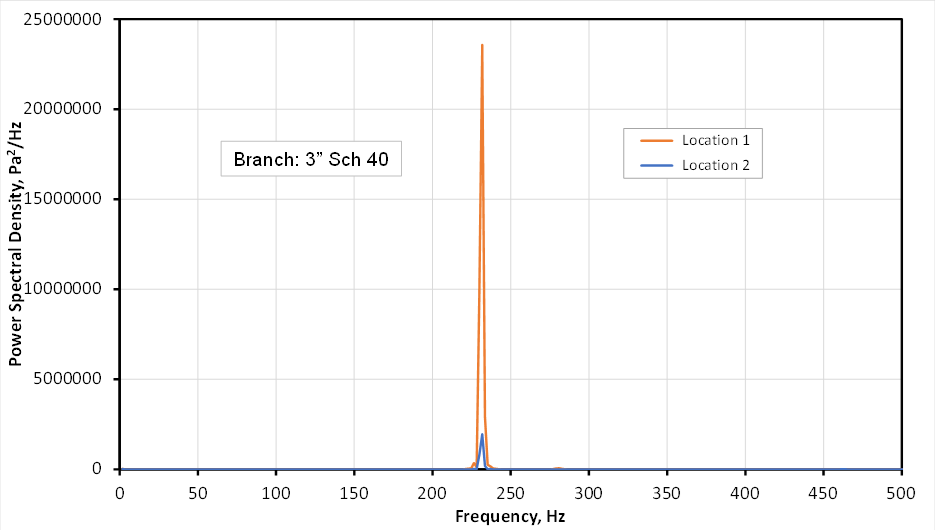
Figure 3. Power Spectral Density of Pressure Signals – 3’’ Branch.
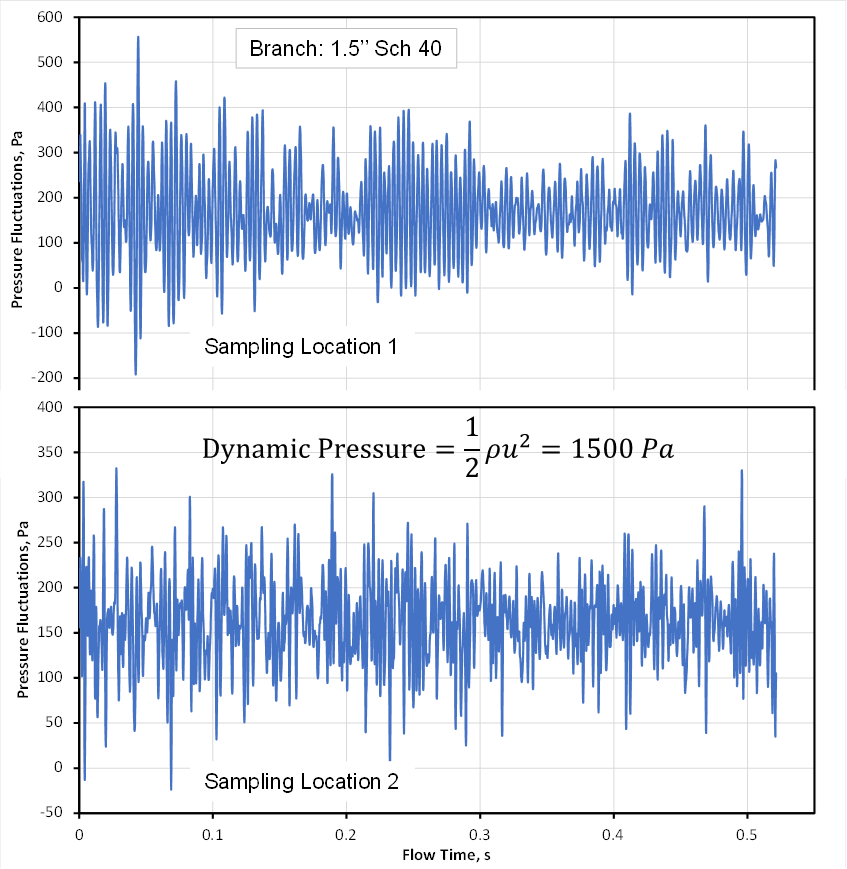
Figure 4. Pressure Fluctuations – 1.5’’ Branch.
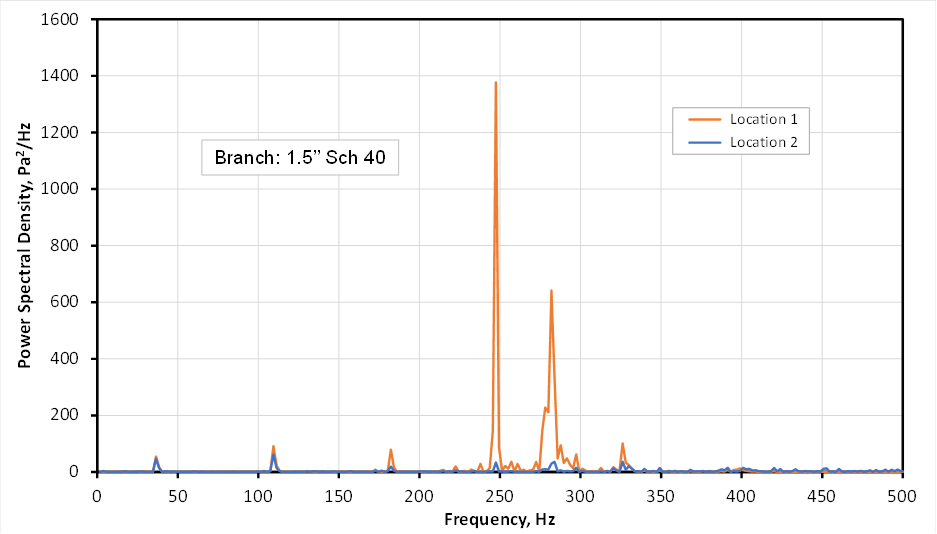
Figure 5. Power Spectral Density of Pressure Signals – 1.5’’ Branch.
