Identifying Worker Density Constraints During Process Outages
How to Identify a Hidden Productivity Constraint in Your Process Outage Plans and Schedules
During inspections and maintenance outages, labor cost is usually a significant expense. In order to meet the required cost and duration goals, worker efficiency is critical. As part of the job plans and schedule creation, a planning team was able to model one crucial feature of labor efficiency – worker density, that is the maximum number of workers that can be allocated to a specific work area over a given time span with minimum productivity losses. As a result, small changes were made to the scheduling of individual tasks.
Work Productivity is a Key Consideration in Continuous Process Outages
The fundamental economics of continuous processing or manufacturing industries dictate that planned production outages would have a negative impact on the bottom line. The opportunity cost (buy vs. make) may be millions of dollars a day in some situations. When you factor in the actual expense of doing the inspection, repair, or enhancement work – which can also run into millions of dollars a day – you have a compelling argument for not only minimizing the outage’s duration but also ensuring that the plan is a realistic one.
In many cases, lost output due to a scheduled shutdown must be recouped by pre-building inventories, obtaining purchases from other locations or third parties, or reducing customer shipments.
Among other items, published best practices call for diligent front-end loading, with detailed planning and scheduling of all work during the production outage. The estimated duration of the outage is a key output from this program.
Each individual work activity is typically assigned a number of job steps with the corresponding labor requirements, including:
- Number of workers
- Trades involved, e.g., carpenters, electricians, welders
- Hours required by each trade for each step
The typical efficiency of each worker for the job at hand is inherent to these scheduled labor hours. Against this assumption, any major productivity losses may have a significant effect on the duration of the outage.
Work Productivity
The real vs. assumed job efficiency would have a significant impact on the outage’s performance. In addition to possibly impacting the overall duration, labor can be the most expensive component of the outage; for example, in the North American petroleum refining industry, labor can account for 60 to 80 percent of the overall cost.
Job productivity is generically defined as the ratio of outputs to inputs. Here is an example:
- Output: Number of tiles installed; surface area painted; volume of concrete placed
- Input: Labor hours – individual worker or work team; equipment hours
Our focus here isn’t so much on how to increase productivity performance – there are many methods for doing so – as it is on how to minimize or remove job constraints so that actual productivity meets or exceeds target.
The labor hours allocated to job plans will include a productivity assumption, which estimates how long an employee or group of employees will take to complete a task.
This inference will be based on the following data:
- Similar work in previous outages
- Planner’s own experience or professional judgement
- Input from execution team
- Factors applied to standard planning norms, if available
Many factors may have an impact on actual job efficiency. Here are a few examples:
- Availability of materials
- Availability, adequacy, and condition of tools
- Access to the work front
- Availability and adequacy of work procedures
- Leadership and supervision
- Quality of job plans
- Worker capabilities
A planning team was concerned a few years ago that a large amount of work in a relatively restricted area would result in occasional overcrowding, preventing workers from reaching their assigned work areas on time. The team had no systematic way to model this in the job plans up until this stage. This paper will explain how this was accomplished.
Worker Density Constraint
Individual job plans determine the optimal number of workers for each task. Jobs are then scheduled based on the plan logic (predecessors, successors) and, if specified in the scheduling tool, the total availability of workers.
Unless explicitly stated as a constraint in job plans or schedules, this approach does not generally account for the effect of multiple work fronts in a specific constrained space or area.
Some common execution restrictions, such as only having a single crane or other equipment serving a particular location, will sometimes resolve this crowding of work fronts. Modern planning and scheduling tools can accommodate this.
Although there is a wealth of literature on the subject of worker efficiency, this author was unable to locate any that comprehensively covered industrial maintenance practices. Although worker crowding, also known as stacking, is frequently discussed, it is rarely quantified. The most pertinent information is available for construction work or manufacturing processes. With respect to construction, the literature claims that typical productivity losses are about 20%, with some papers reporting up to 50% losses due to crowding or stacking
A few of the texts attempt to determine what staff density is best for minimizing productivity losses. The results are very divergent – for a quick overview of the literature examined, see Figure 1.
|
# of workers per |
|||
|
Sq. ft. |
Sq. m. |
Type of Work |
|
|
21.5 |
2 |
Commercial construction |
|
|
269.1 |
25 |
Industrial projects |
|
|
169.0 |
15.7 |
Concrete foundations |
|
|
200-250 |
18.6-23.2 |
Construction |
|
|
191 |
17.7 |
Electrical work; 0% productivity losses |
|
|
90 |
8.4 |
Electrical work; 50% productivity losses |
|
Figure 1 – Ideal Worker Density (from literature reviewed)
Modeling Worker Density During Job Planning
The planners in this case study were faced with the repair and replacement of large quantities of piping and valves during a planned outage at a petroleum refinery process unit. This was in addition to the regular inspection and maintenance scope of pressure vessels, heat exchangers, major machinery, and so on.
This piping and valve work was distributed throughout the unit, and none of it was significant enough to determine the outage’s overall duration; in other words, none of it was on the critical path schedule.
Nonetheless, the planners were concerned that due to conflicts with other work in the same area at the same time, the workers might not be able to access their designated work fronts when scheduled.
To visualize this, the planners divided the process unit into individual geographical grids in order to confirm where and when these conflicts might occur. The grid sizes were determined using some of the data shown in Figure 1 and, more importantly, input from the maintenance execution team and contractors, as there were no clear benchmarks for optimal work front size.
This approach can be applied both horizontally and vertically:
- At ground level or any major horizontal surface such as large elevated platforms
- To reflect the impact of vertical tiered work
- A combination of both, all in an attempt to capture possible work front interferences during the planning stage
The following figures, 2a and 2b, provide descriptive examples:
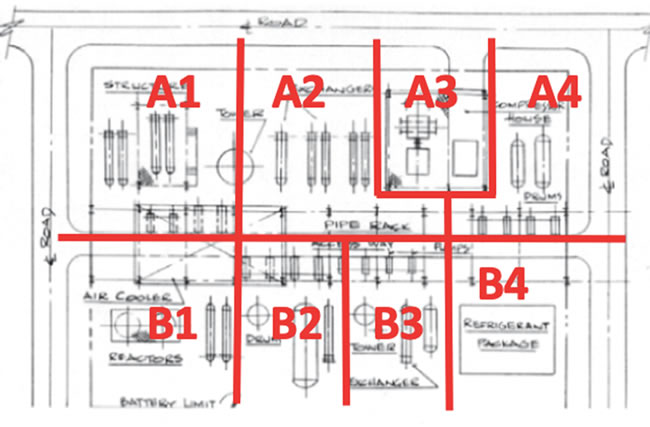
Figure 2a – Example of planning layout grid for a petroleum processing unit – at ground level.
Notice the planner assigned a separate work grid to the compressor house (A3) and to the refrigerant package (B4). (Not to scale)
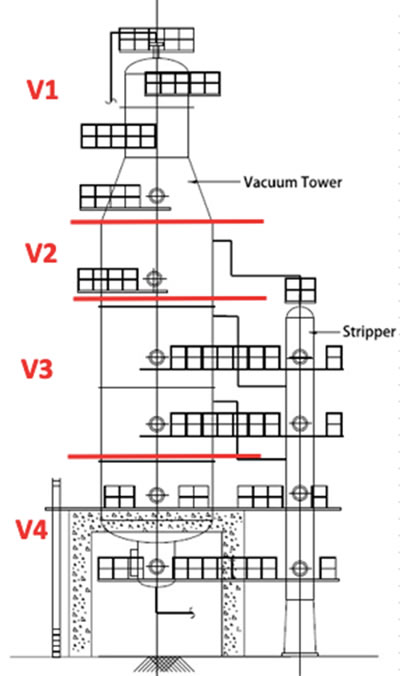
Figure 2b – Example of a planning vertical layout grid for a crude oil distillation tower
(Not to scale)
The next step is to assign a unique sortable code in the planning software to the job step, such as a specific activity code in Primavera P6™, and assign the appropriate grid number to each job step.
For each location grid, a histogram showing the number of workers during each shift was created as part of the schedule optimization stage, as shown in the following figure.
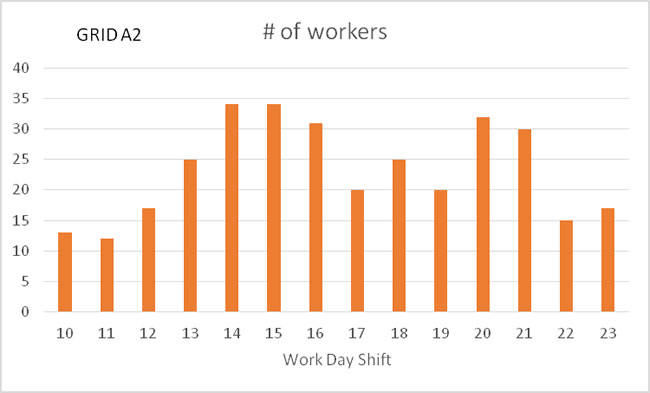
Figure 3a – Example of worker histogram for day shift at a specific grid location
How This Information Was Used
For the first-time use of this approach, the planning team did not explore a method to have the software adjust the work schedule to compensate for worker density constraint. The histograms were thoroughly examined by the execution team, which included the work’s contractors. Individual jobs could be ‘manually’ rescheduled to avoid noticeable worker density peaks where possible following several site visits and considering the team’s experience with previous outages at this unit. The final result is shown in Figures 3b and 3c.
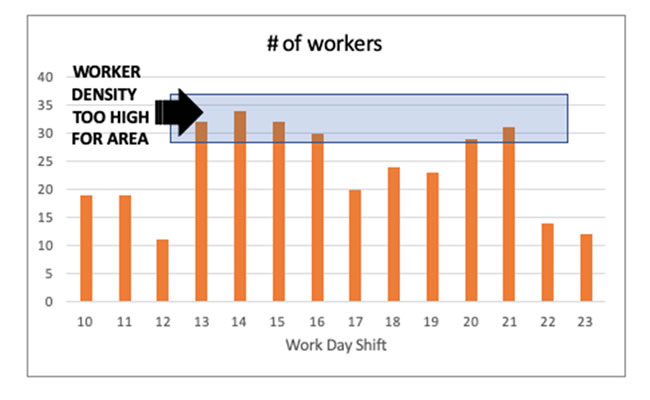
Figure 3b – Example of worker histogram for a specific location, showing possible worker
density limit as determined by the outage planning and execution teams
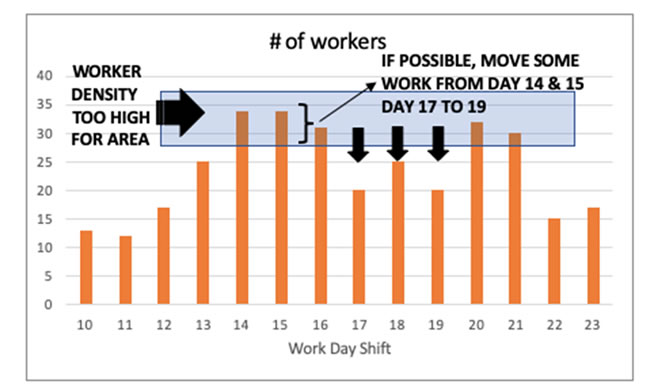
Figure 3c – Possible mitigation to the worker density constraint
When and How to Consider This Approach
While simple, this method of identifying worker density constraints taught the planning team some valuable lessons.
- Consider the importance of any unusually large quantity of work within a unit or specific work area – whether on the horizontal or vertical ‘scale’ – when looking at the outage’s work scope at a high level.
- Consider the impact of additional discovery or found work as well.
- Begin this approach as soon as the planning process begins – while it is possible to do so after the planning work is substantially completed, it will be inconvenient and time consuming.
- Apply the location grids in the job plans consistently by properly informing the planning team – large posters work great!
Conclusions
Given the significant amount of labor required to complete inspection and maintenance work during production outages, workforce productivity is critical.
While there are numerous documents on the subject of worker productivity, the majority focus on either manufacturing or construction. Nonetheless, many of the same factors that affect labor efficiency apply in the context of a production outage.
We saw how, while preparing for a major outage at a petroleum refinery, a planning team became concerned that high worker density, or the number of workers assigned to a specific area in a given period of time, could negatively impact their productivity. If left unaddressed, and in the worst-case scenario, this could lengthen the outage.
During the planning phase, the team developed a simple methodology for measuring worker density and was able to make schedule adjustments as needed.


