LIFE MANAGEMENT OF PSA VESSELS – Part 1: Measuring long seam weld peaking
Introducing the first blog in a trilogy about the life management and assessment of Pressure Swing Absorber (PSA) vessels. Can the lifespan of a PSA can be extended beyond its designed lifespan of 20 to 30 years of service?
Operators often start worrying about the integrity of their PSA vessels as these approach the end of their design lives, but is this too late? A frequently overlooked aspect in the life assessment of pressure vessels in cyclic service is longitudinal weld peaking, along with other anomalies such as ovality or misalignment. These weld anomalies can significantly increase stress, potentially leading to a much shorter lifespan than originally intended.
The issue leading to the potential for early fatigue cracking on the inner diameter (ID) of the vessels is the inherent bending stress caused by the weld anomalies. To determine the magnitude of the bending stress, the longitudinal weld peaking needs to be measured. In this article, we compared the peaking values obtained using both manual peaking measurements and laser scanning, and then reviewed the subsequent calculated fatigue life results.
This blog will focus on understanding the measurements of weld peaking and the impact on the associated stress increase. There are several methods currently being used to measure longitudinal weld seam peaking. The traditional method involves using a rocking template across the weld, as proposed in API 579:2021 (Figure 1). This method requires scaffolding to be built around each vessel and does not allow for the measurement of ovality. Weld misalignment can be measured using a weld gauge.
Figure 1 Peaking measurements using a template as proposed by API 579:2021
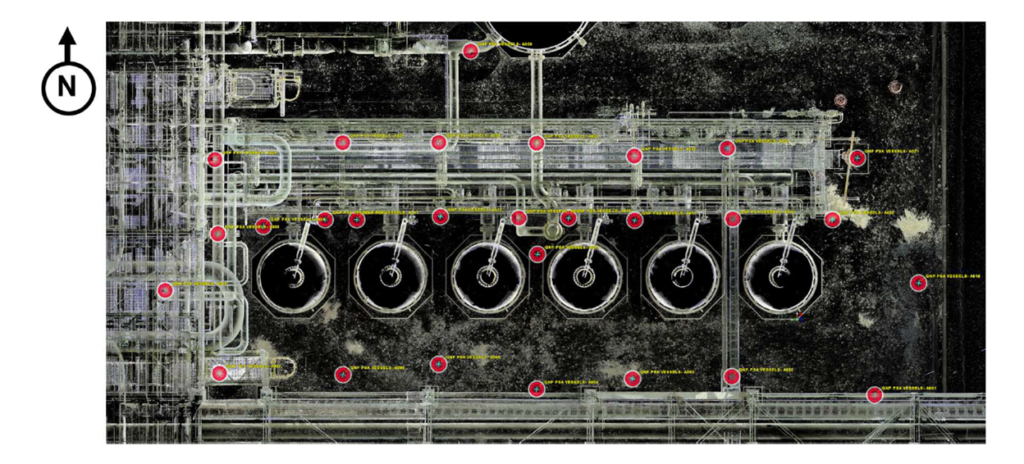
Another more recent method involves using laser scanning to obtain a 3D topographical map of the scanned surfaces. The scans are carried out from various locations to capture entire surfaces of interest. An example of a scan map for 6 PSA vessels from 28 different scan locations is shown in Figure 2.


The laser scan data, collected as point cloud data, can be imported into a Finite Element Analysis (FEA) package with minor data manipulation. Laser scanning captures a map of the surface, including peaking, ovality, and misalignment, which is then automatically factored into the FEA and therefore the effects of peaking are directly derived by reviewing the stress analysis results, as shown in Figure 3. The stress on both the inside and outside of the vessels is automatically calculated and the subsequent bending stress due to the anomalies can be derived directly from the FEA.


Figure 3 laser scanning before and after data clean up (left) and FEA results with stress in MPa (right)
When measuring peaking manually using a template, the inspector has to make decisions regarding the shape of the deformation. For instance, API 579 offers two different ways of conducting calculations, depending on whether it is believed to be global or local peaking, as shown in Figure 4.

An example of one vessel that exhibited a mix of longitudinal seam weld peaking, weld misalignments, and ovality underwent both laser scanning and manual peaking measurements. The measurements, the membrane to bending ratio (Rb), and the associated stress for the fatigue behavior are shown in Table 1. The number of allowable fatigue cycles is shown for mean behavior for curve D in accordance with BS7608:2015[4] for each scenario (laser scanning, manual measurement assuming local or global peaking).
Table 1 Summary of peaking measurement, associated bending components and fatigue life
| Method of measuring peaking | Measured peaking, mm | Weld Misalignment,
mm |
Rb ratio | Hoop stress due to internal pressure, MPa | Additional bending stress due to peaking, MPa | Number of allowable fatigue cycles(2) | Number of allowable fatigue cycles with no peaking |
| Laser scanning | N/A | N/A | 1.23(1) | 94 | 116 | 4.5 ´ 105 | 4.8 ´ 106 |
| Manual measurement | 8.0 | 1.5 | 1.49
(Local) |
140 | 3.3 ´ 105 | ||
| 0.74
(Global) |
70 | 9.1 ´ 105 |
Notes:
- The laser scan measurement automatically could also include weld misalignment and effect of ovality which is not captured from the manual measurements.
- Using BS7608:2015 [4] Mean curve D.
The allowable number of cycles including the effect of additional bending stress may be compared with the allowable fatigue cycles assuming no peaking. The reduction in fatigue performance due to peaking is very significant, comprising more than a ten-fold reduction in expected life. The calculated number of cycles is also dependent on which measurement method is used, and a factor of three difference in life can be found between the three methods used.
It should be noted that the level of peaking measured in this vessel was one of the most severe that we have encountered. However, a peaking measurement between 3-4 mm is not uncommon, and will also severely affect the fatigue performance of the vessel.
In part 2, we will focus on the fatigue crack growth of PSA long seam welds.
References
- Karstensen, A, Seipp, T and Nadaranjan,C Life management of Pressure Swing Absorbers. Proceedings of ASME 2023 PVP 2023-107766
- Altstadt, S, Karstensen, A and Picioccio, K “Advance in PSA vessel life management. AIChE Ethylene conference 2024 Spring National Meeting New Orleans, LA. March 25-29, 2024
- The American Petroleum Institute and The American Society of Mechanical Engineers, Fitness-for-Service API 579-1/ASME FFS-1 (API 579 Second Edition).
© API Publishing Services June, 2021 - British Standards Institution BS7608:2014+A1:2015 “Code of practice for fatigue design and assessment of steel structure
