Use of Computational Fluid Dynamics Modeling for Erosion Predictions
Erosion is a mechanical degradation process in which the material gradually wears off due to continuous impingement of abrasive solid particles, which leads to deformation, chipping, and/or cracking of the material surface. Erosion often occurs in various engineering flow systems where fluids are transported with entrained solid particles. In regions where the flow direction changes, such as elbows, the momentum of the solid particles causes separation of the particles from the fluid stream and subsequent impingement of the particles on the wall of the flow system. Thus, erosion occurs. It is important to determine the erosion rate for given operating conditions in a flow system since this will allow the owner of the equipment to estimate the service life of the equipment and to determine the locations where erosion is most likely to occur so that preventive measures can be taken. This blog discusses the use of computational fluid dynamics (CFD) modeling for predicting erosion rates in a waste heat boiler (WHB).
The operator of a waste heat boiler found a tube leakage on the lower right-hand sidewall (RHSW) of the waste heater boiler downstream of an FCC unit. The leakage was believed to be caused by erosion wear because of the high catalyst carryover caused by cracks in the cyclones of the FCC unit. The damaged tubes were repaired and covered with a protective spray coating. It was expected that tube leakage was unlikely to happen again if the catalyst carryover was not substantially higher than the typical particulate carryover. Becht performed a CFD analysis to evaluate the erosion rate in the flow system for two particulate flow rates: one is the high catalyst carryover due to cracks in the cyclones of the FCC unit and the other is for normal operating conditions which include approximately 8% of the high catalyst carryover. The model included the connecting flue ducts between the FCC unit and the boiler, but only the results for the boiler are presented here.
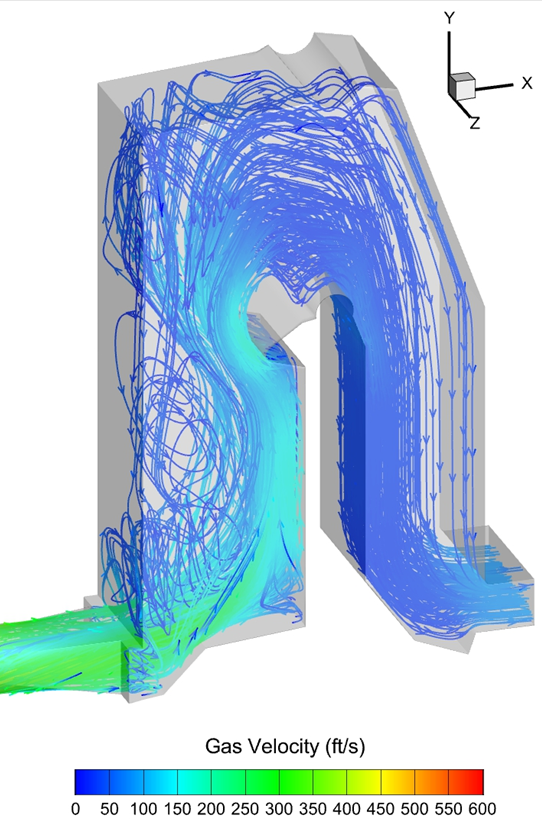
Figure 1 shows the gas velocity distribution in the boiler. The maximum gas velocity at the boiler inlet is approximately 300 ft/s. The high gas velocities near the side walls and the boiler arch lead to high particle velocities which may result in high erosion rates.
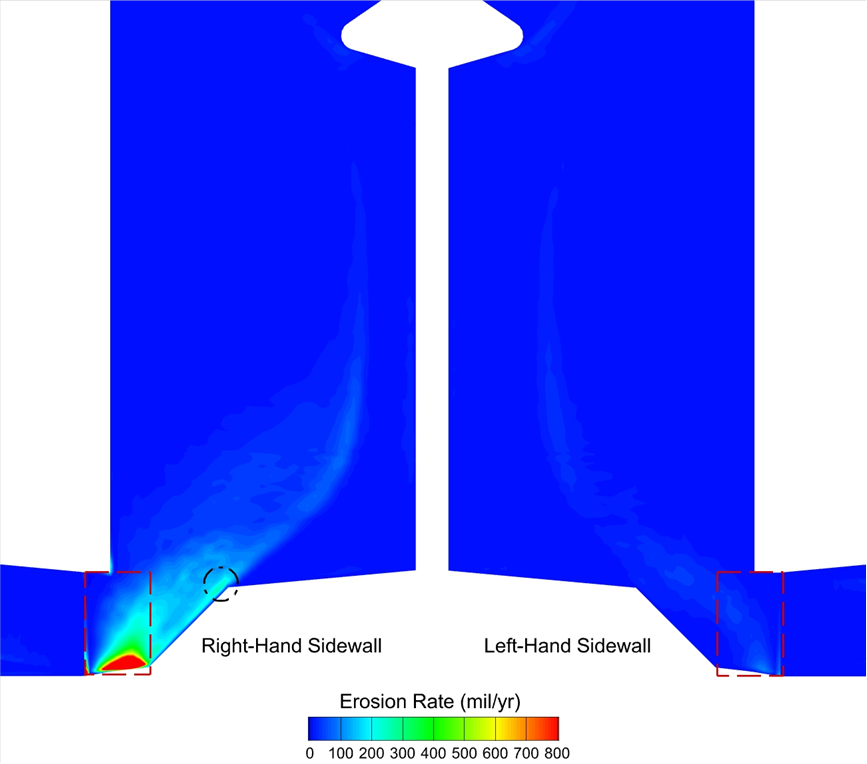
Figure 2 shows the erosion rate distribution on the side walls of the boiler for the case with a high catalyst carryover. The erosion rate on the right-hand sidewall (RHSW) is higher than that on the left-hand sidewall (LHSW) of the boiler due to the arrangement of the flue ducts and the boiler inlet. The regions in the dashed-line boxes near the side walls of the boiler are two recirculation regions where the particles accumulate and insulate the boiler tubes from the gas stream. As a result, the erosion prediction is no longer an indication of potential erosion wear in these regions. For the region outside the dashed-line boxes, the maximum erosion rate is 206 mil/yr on the RHSW of the boiler. For such an erosion rate, with a tube thickness of 0.180’’ in the lower boiler, it may only take 10.5 months for tube leakage to occur. The operator of the boiler indicated that the boiler was operated with the high catalyst carryover for approximately one year. Note that the location of the highest erosion rate coincides with the location where tube failure was found.
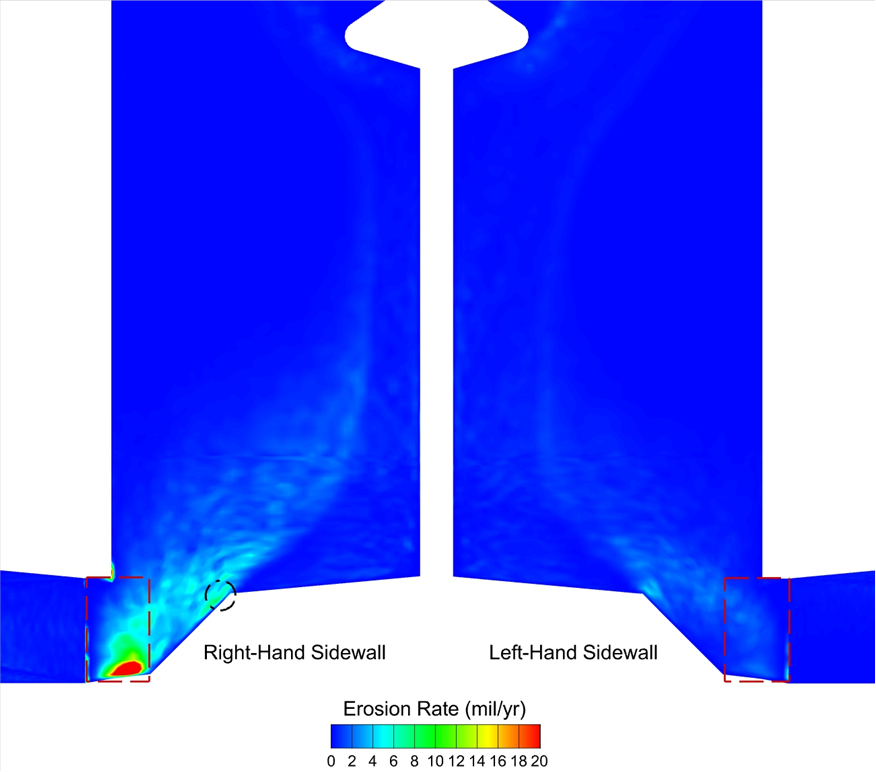
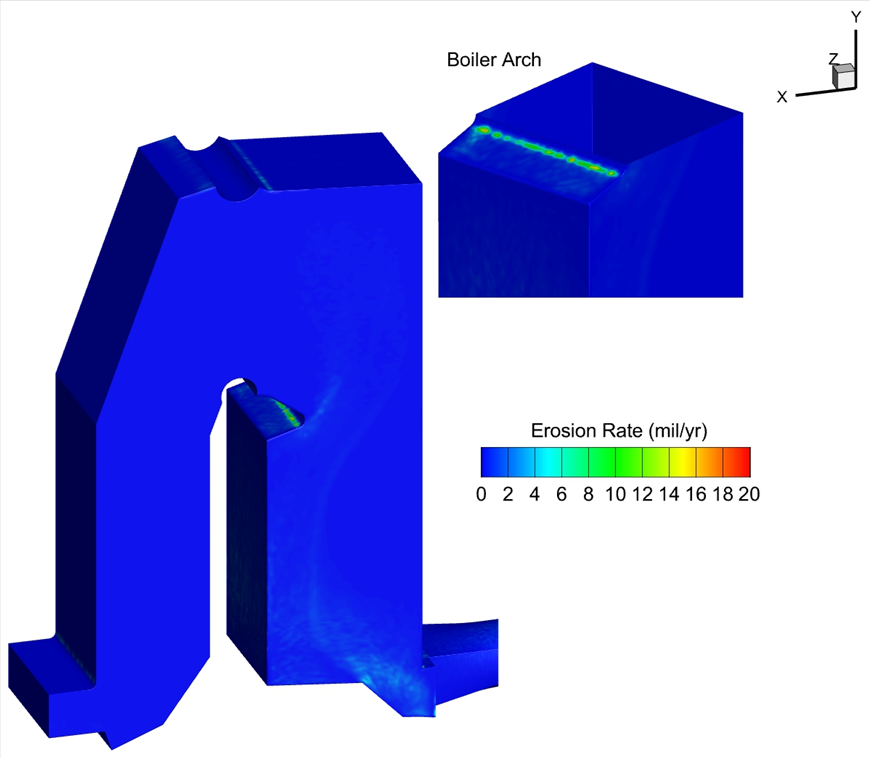
Figures 3a and 3b illustrate the erosion rate distribution for the case with the normal operating conditions. Like in the case with the high catalyst carryover, the erosion rate on the RHSW is higher than that on the LHSW of the boiler. The highest erosion rate is near the bottom of the duct in the dashed-line box where particles accumulate due to flow recirculation, which protects the boiler tubes from erosion wear. Therefore, erosion damage is unlikely to occur in this region.
The erosion rate at the boiler arch is high; the maximum erosion rate at the arch is 18.5 mil/yr. With a tube thickness of 0.165’’ in the upper boiler, tube leakage is likely to occur in approximately 9 years. For the sidewalls of the boiler, for the region outside the dashed-line box, the maximum erosion rate is 6.6 mil/yr on the RHSW of the boiler, as indicated in the circle. For a tube thickness of 0.180’’ in the lower boiler, tube leakage may occur in 27 years under the normal operating conditions and typical catalyst carryover.
The results discussed above show that for both cases the erosion rate on the RHSW of the boiler is significantly higher than that on the LHSW of the boiler. This agrees with what was observed in the plant where it was found that the tube leakage occurred on the RHSW of the boiler due to high catalyst loss rates, while the tubes on the LHSW did not have any damage.
Based on the modeling results, it was recommended that a protective spray coating be applied to the tubes on the sidewalls of the lower boiler and at the boiler arch. Whenever possible, the wall tubes of the lower boiler should be inspected to ensure that erosion wear is acceptable. The wall tubes at the boiler arch should also be inspected routinely. The catalyst carryover should be closely monitored. To minimize erosion damage to the boiler tubes, catalyst loss should be kept minimum.
The example given above shows how CFD modeling may be used to predict erosion rates in a waste heat boiler. Similar approaches may also be used in other gas-solid two-phase flow systems when erosion is a concern.

Figure 1. Distribution of Flue Gas Velocity.

Figure 2. Distribution of Erosion Rate – High Catalyst Carryover.

Figure 3a. Distribution of Erosion Rate – Typical Catalyst Carryover.

Figure 3b. Distribution of Erosion Rate – Typical Catalyst Carryover.
