Breakthroughs in Predictive HTHA Life Assessment: Time Dependent Nelson Curves and Inspection Planning Enhancements
Published in the Inspectioneering Journal, January/February 2022
Introduction
Nearly two years ago, in an Inspectioneering Journal article, Practical HTHA Experience and Time-Based Nelson Curves for Improved Equipment Life Management, we described how to incorporate well-established void growth modeling (see Figure 1) into a high temperature hydrogen attack (HTHA) assessment approach [1]. Since then, we have made the following advances:
- Inclusion of pressure and weld residual stresses, and nucleation effects [2, 3]
- Addition of C-0.5Mo material ([4, 5])
- Direct relation of the damage and life fractions the model predicts to both microstructural damage and toughness loss
- Definition of a simple but predictive through-wall failure criterion
- Model informed HTHA flaw detection and sizing guidance for component life extension
- Validation of through-wall damage predictions in almost 100 case histories
Taken together, these advances have enabled a breakthrough in predictive component life assessment for carbon and C-0.5Mo steels in high temperature hydrogen service.
The ability to relate model predictions to physical damage is exciting and is a major focus of our planned work over the next 1 to 2 years. In fact, a primary motivation for pursuing a more quantitative model was the repeated HTHA nondestructive examination (NDE) false calls and the strain it put on industry. HTHA NDE has evolved significantly in the last five years, and we believe we’re at an inflection point where modeling and inspection can be used together to make safe and informed decisions in a much shorter time frame and with much less disruption. A real-life example is given to illustrate how this can be accomplished with an approach that will be validated by leveraging extensive ex-service material.
With a focus on practicality, we end this article by presenting time-dependent Nelson-Curves that consolidate volumes of information into convenient charts, which we hope will make much of the progress this article describes readily available to those who need it.

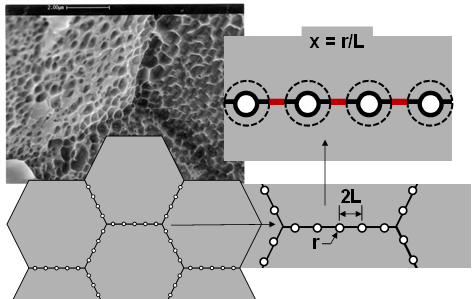
(SEM image from Reference [6])
Figure 1 – Idealized Void Growth Models
Relating Model Damage to Physical Damage
The primary validation to a predictive model that can be harmonized with inspection is relating what the model predicts to what we can “see” (physical damage) and it’s impact on structural integrity (property loss). Lui and Lundin [6] paved the way for this in support of a previous HTHA joint industry project by measuring both the fraction of grain boundary length attacked (FL) and the Charpy impact energy (CV) through the wall of a damaged component.
Here we leverage these measurements to create two simple definitions of damage that are complementary:
Damage Based on Grain Boundary Length Attacked:

Damage Based on Property Loss:

Plugging the measured properties into the above equations gives results shown in Figure 2. The microstructural damage and property-loss damage lie right on top of one another and closely match the physically visible damage as well. A key point is that the impact energy appears to hit a lower shelf while the fraction of grain boundaries attacked is still increasing dramatically – from about only 15%-25% attack to nearly 60% attack at the inside surface. Twenty-five percent was found to give the best match to the toughness-based damage and is what’s shown above (“FLcrit = 0.25”).
Note there are no model predictions involved yet – this is simply showing that there is a direct link between grain boundary length attack and property loss. The next step is to compare the void growth model output to these results. The Becht model prediction is shown in Figure 3. The agreement is remarkable, providing the desired linkage between microstructure, properties, and model prediction. We can even visualize the model damage as illustrated in Figure 4 to further reinforce the tie between what the model predicts and what exists in a component.
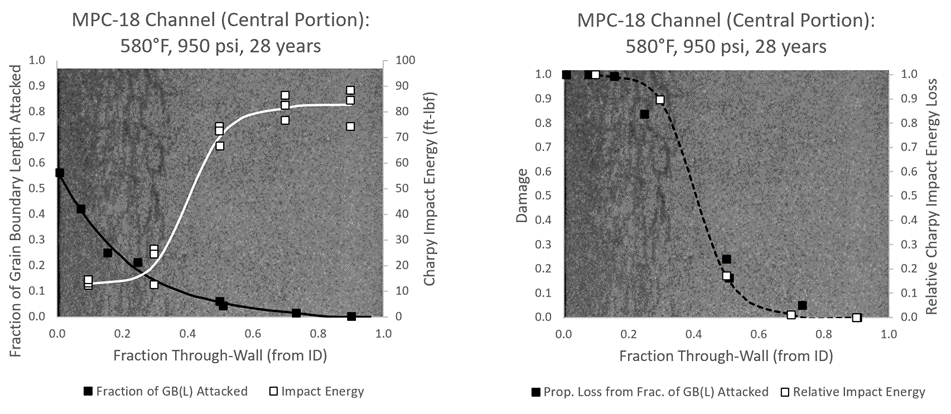
(Background image from [6])
Figure 2 – Measured Properties Converted to Damage
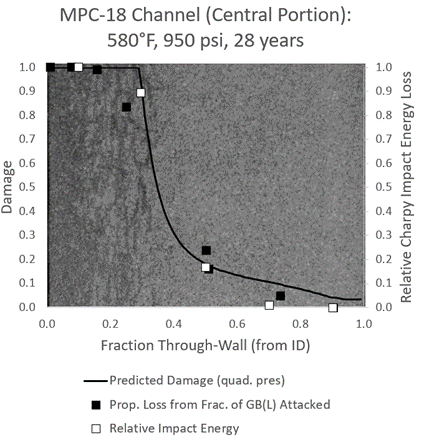
Figure 3 – Model Predicted Damage Compared to Physical Damage Measures

(Images from Reference [6])
Figure 4 – Progression of HTHA Damage Model Corresponds To
Local Failure vs. Component Failure
As shown in the previous section, we can model damage progression from the inside surface of a component further inboard with time. But when does that damage become too much? When does the component fail?
We define component failure (burst or leakage) based on the type of damage present. The widespread damage shown in Figures 2 and 3 represents classic examples of volumetric damage. HTHA damage can also concentrate near a weld, most often in the as-welded (no post-weld heat treatment [PWHT]) condition, but sometimes even when PWHT has been performed. These two distinct types of damage are illustrated in Figure 5.
Void growth models can predict damage progression at any point through a component – the effective hydrogen partial pressure, applied stress, and temperature at any given point are simply plugged into the model and the damage calculated. Because of the through-wall decay of the hydrogen partial pressure shown in Figure 6, damage in real components concentrates towards the inside surface initially. For example, by 25% wall depth the effective partial pressure has dropped by nearly half, and at the mid-wall it’s only a quarter of the surface value.
With this line of reasoning a component failure criterion of 100% damage to 25% depth was defined – as illustrated at the top of Figure 7. This criterion simply means that once a dominant crack forms, crack growth will proceed much more rapidly than the initiation phase captured by the void growth model. This is reasonable since the crack allows the hydrogen to continually penetrate deeper into the wall with a proportional increase in damage driving force/methane pressure. The crack is obviously also a major source of stress concentration that will further accelerate damage.
We can combine these ideas of through-wall damage and a component failure criterion to create “failure” Nelson Curves. In fact, one can create Nelson Curves for any damage state desired. This is illustrated in Figure 7, where “failure” just being reached at or near the surface (“initiation of macro-damage”) is compared with failure reaching all the way to 25% wall (“through-wall failure”). The corresponding through-wall damage distributions are also shown for clarity. This global failure criterion is the final piece in creating a predictive model that can change the way we manage equipment in HTHA service.
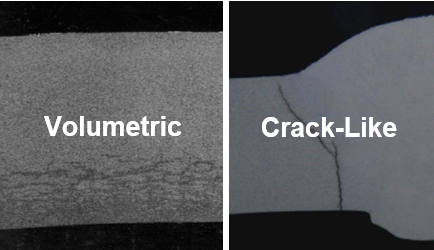
Figure 5 – Illustration of HTHA Damage Types
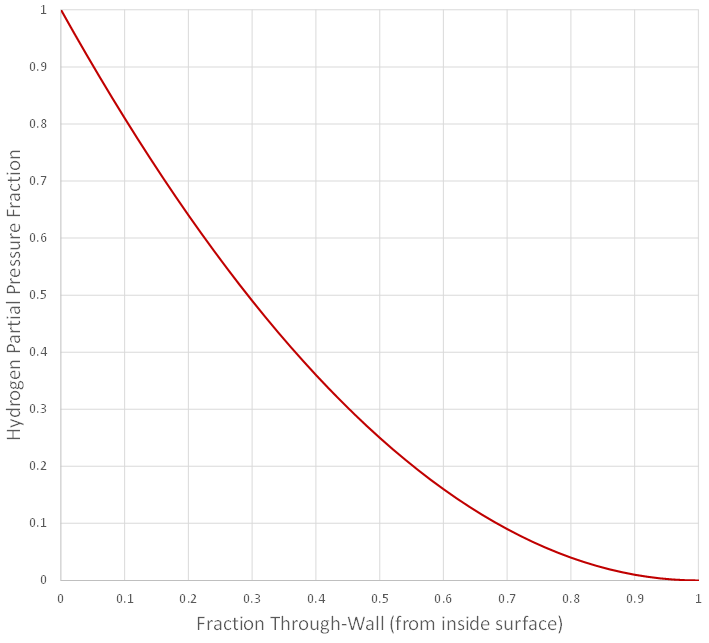
Figure 6 – Decay of Hydrogen Partial Pressure Through-Wall
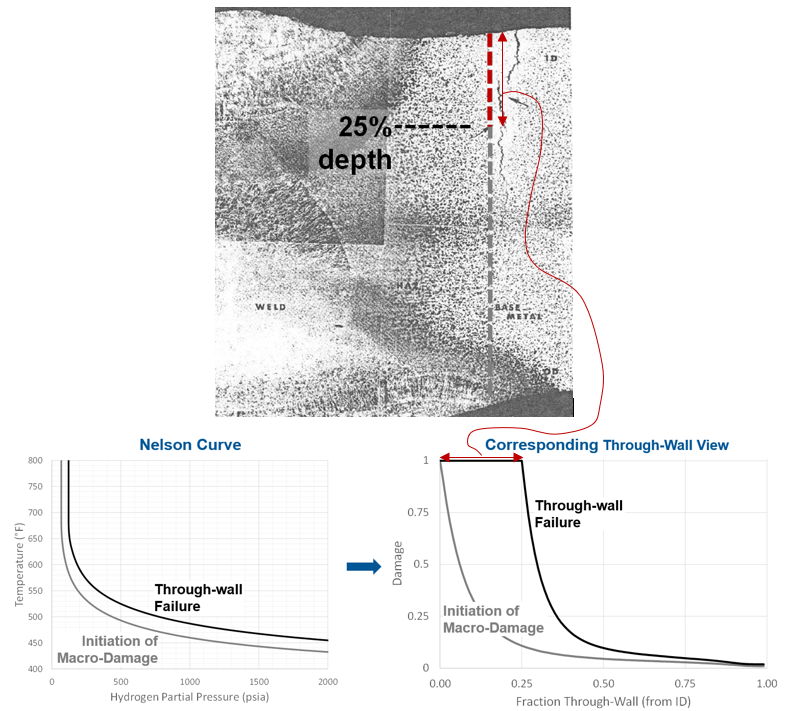
Note: Results correspond to 200,000 hours for PWHT carbon steel, minimum resistance
Figure 7 – Component Failure Criterion for Crack-Like Damage and Nelson Curves for Different Damage Depths
Validation to API RP 941 Data Points
We’ve shown how we relate void growth model results directly to physical damage, property loss and actual component failure; the critical remaining question being does it work in practice? To answer that question, we’ve focused on a comprehensive validation effort over the past two years. The most important HTHA data for validation are the data that the current API RP 941 data points are based on [7, 8]. These data are further supplemented with short term data from Weiner’s experiments and with the data and case histories in reference (termed “MPC” cases for convenience) [6, 9]. The specific points analyzed are presented in Table 1. Focus is intentionally placed on only publicly available points; while we have validated to many more cases, these more recent studies typically have substantially more data and in all cases have not changed the fit (in fact they tend to reduce scatter overall).
All the points in Table 1 have been thoroughly researched and modeled to the level of specific damage depth and character [2-5]. Carbon steel validation results are shown in Figure 8, expressed in terms of actual life vs. predicted life. Results of the analysis show that 90% of the data is captured within a factor of 10 on life. This magnitude of variability is typical for creep and fatigue data and is therefore a very reasonable result. With this basis, average and minimum Carbon Steel Nelson Curves can be constructed.
An example leveraging both average and minimum resistance results is shown in Figure 9 for API Point 16 (Incubation Point J, from Evans) where damage ranged from no attack to severe attack in two years in different components [10]. As shown, having a meaningful definition of minimum and average allows these very different results to be rationalized. While “no attack” points are not listed in Table 1, many are evaluated, with a longer term example shown in Figure 10, further illustrating the model’s ability to discriminate states of damage. Finally, all the API RP 941 non-PWHT (as-welded) carbon steel points are shown plotted against worst-case predictions in Figure 11. As shown, while scatter is obvious, clear trends are evident and conservatively captured with the model.
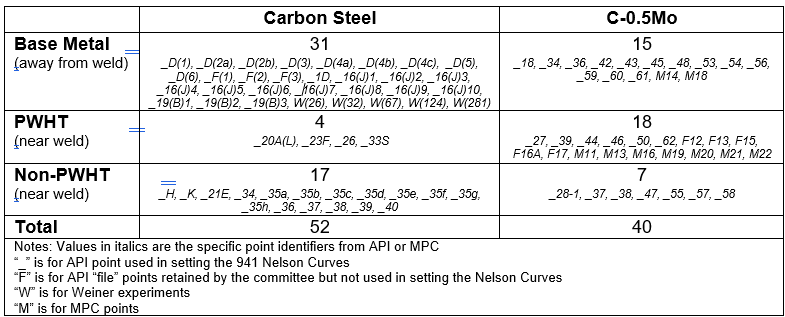
Table 1 – Points Used in Validation
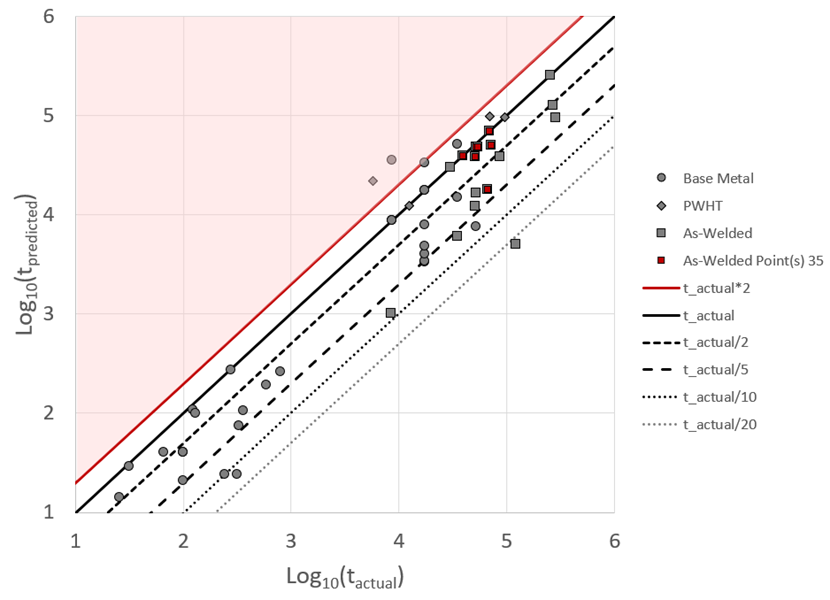
Figure 8 – Carbon Steel Calibration Results
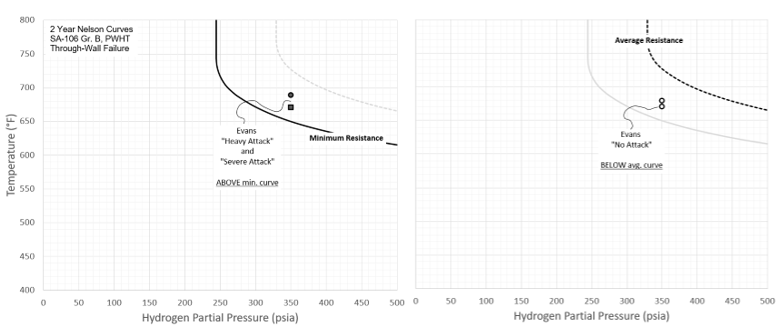
Figure 9 – Discriminating Attack vs. No Attack at the Same Conditions
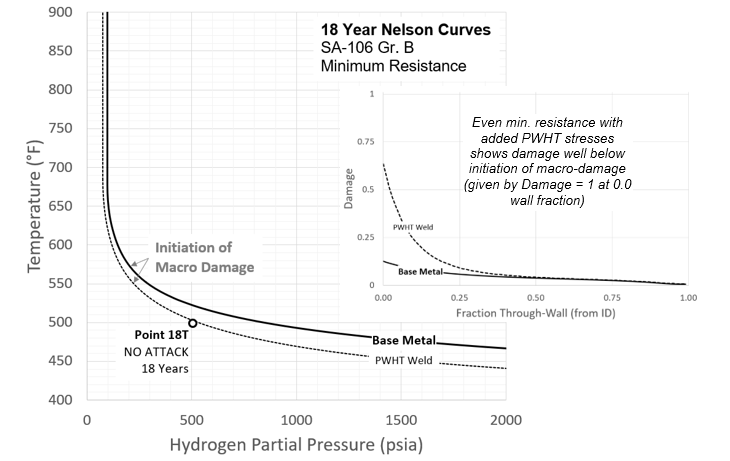
Figure 10 – Discriminating Attack vs. No Attack Longer Term Example
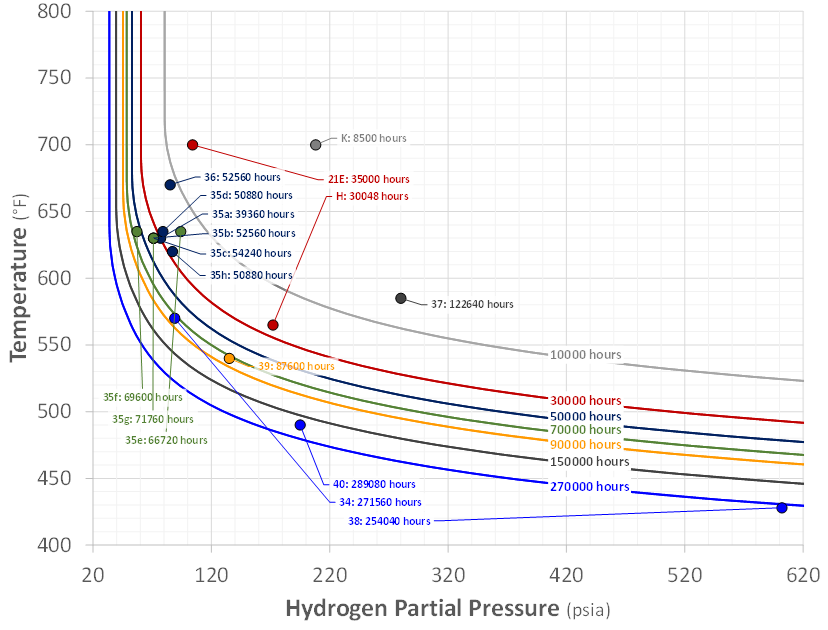
Note: API Point 38 is plotted against a through-wall failure curve; Point 38 is bounded when plotted against the actual damage state curve (20% wall crack prediction curve)
Figure 11 – 941 Non-PWHT Carbon Steel Data Points vs. Min. Resistance Predictions
The model extension for C-0.5Mo is covered in detail elsewhere, but this method uses the carbon activity (ac) as a single scaling parameter to correlate response – this is consistent with the approach suggested in the API TR 941 [4, 5]. The carbon activity affects the methane pressure, and in this model also scales the activation energies between common values for different alloys. Whereas all carbon steel validation used a carbon activity of 1 (standard for carbon steel), for C-0.5Mo the value is iterated on until the damage type and extent for the given conditions are obtained. This variation in carbon activity can likely be estimated more directly from data such as PWHT times and temperatures, alloy content, etc. – another focus area for our on-going work.
The overall results of the C-0.5Mo calibration are presented in terms of the ac values obtained for each of the cases (with two extreme outliers neglected) in Figure 12 [5]. Some further detail of the calibration process is shown in Figure 13 for the MPC cases. As shown the fidelity of the through-wall “fits” using the extended definition of damage presented earlier in this article are excellent, and the range of values obtained are well within those expected for C-0.5Mo material.
Finally, the resulting best fit normal distribution is also shown in Figure 12. The distribution has a mean carbon activity value of 0.55 and an ac of 0.75 captures 97.5% of the data. The difference between the mean (0.55) and -2*sigma (0.75) results represents a significant variation in expected life, or in allowed temperature for a given partial pressure and time. This range of behavior is shown in Nelson Curve form in Figure 14 and fills in the expected space between the former API RP 941 C-0.5Mo line and the current carbon steel line extremely well. This variability makes relating critical factors such as Mo/C ratio and fabrication variables important to predicting where a given component’s performance will fall within the scatter band.
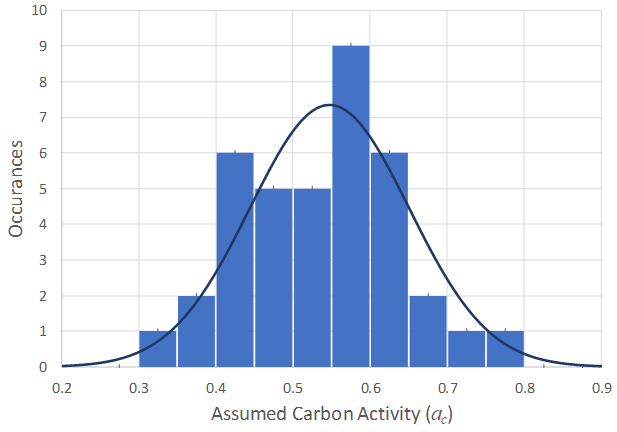
Figure 12 – Carbon Activity C-0.5Mo Calibration Results and Corresponding Normal Distribution
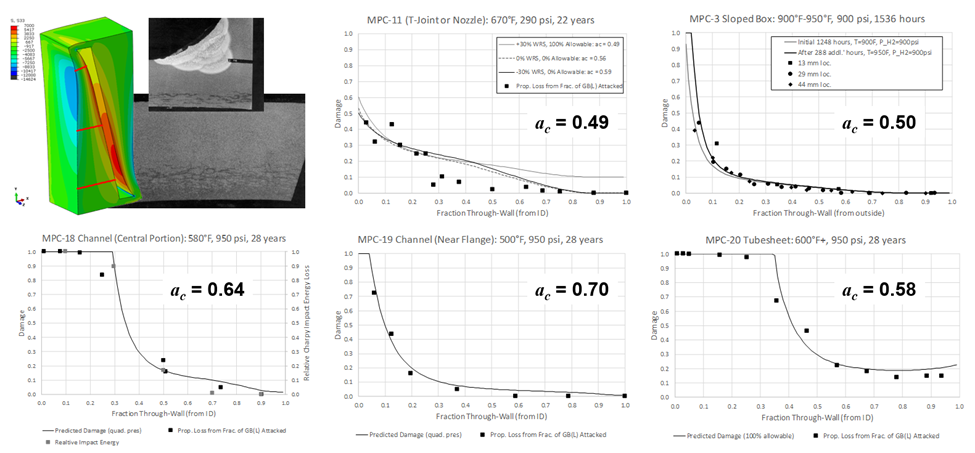
Figure 13 – Calibration Results Detail for MPC Cases
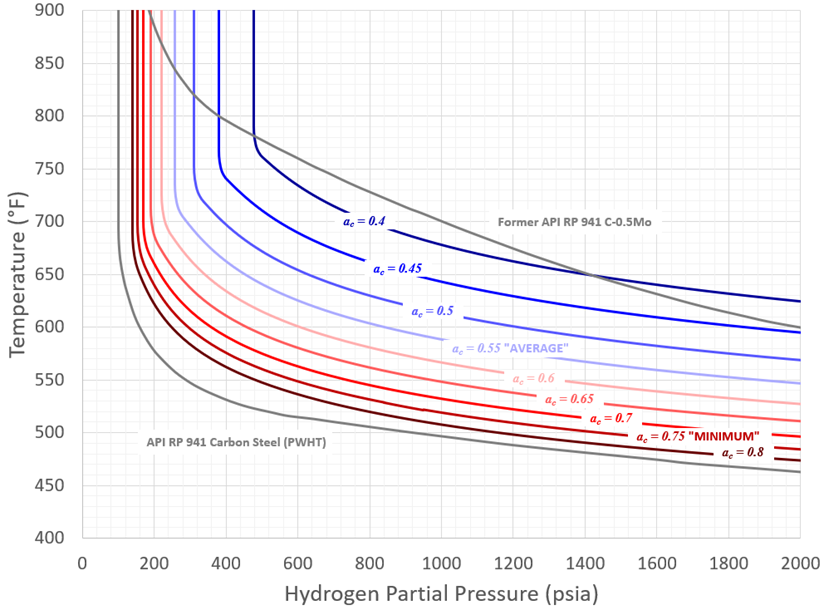
Figure 14 – Range of Predicted C-0.5Mo Nelson Curves
Corresponding to Calibration Results
Damage Model Link with Inspection and Operating History: A Case Study
To demonstrate how the validated and calibrated model can be leveraged to reduce uncertainty and improve options, a real-world case study is evaluated in this section. The component in question is a 50-year-old high temperature shift converter with the following characteristics:
- Design Temperature: 850°F
- Design Pressure: 310 psig
- Operating Temperature: 810°F
- Operating Pressure: 275 psig
- Typical H2 Partial Pressure: 135 psia
The complete vessel received PWHT prior to entering service and is shown in Figure 15. After 50 years, PAUT was performed at the locations also shown in Figure 15 with no findings. Subsequently, high sensitivity NDE was also performed with possible HTHA-related voids identified.
Figure 16 shows the best guess operating conditions plotted along with the model minimum, average and best case performance through-wall failure lines for PWHT C-0.5Mo at 50 years. For material resistance approaching worst case, the shift converter would be predicted to be at failure already. One the other hand, significant margin would exist relative to best case performance. How do we know which case is the right one?
One of the first refinements we can make to the analysis, regardless of which material resistance is the right one, is to make use of the daily operating data available from start-of-run to end-of-run (3-year period). These data are shown repeated out to 50 years in Figure 17, which assumes the shift converter has always operated that way for illustration.
The more important refinement, however, is the link to the available inspection results. This concept was first presented more than 20 years ago as part of a past joint industry project (Materials Properties Council Moly-Hy Joint Industry Program) on HTHA and is illustrated in Figure 18. This is the same case shown in Figures 2 and 3, but with the long seam vessel weld and corresponding traditional UT scan included in Figure 18. What the figure shows is that the signal passes through the weld where there is no macro-HTHA damage but is reflected in the base metal as soon as the significant damage is reached. Essentially, this allows us to use the traditional phased array ultrasonic testing (PAUT) result for the shift converter to state that there is no macro-HTHA damage through the wall. We can also use the advanced, high-sensitivity NDE result to assign a damage level consistent with isolated voiding/early stage HTHA damage, which at the maximum (right up to local fissuring) would be 0.5, assumed at the inside surface.
Figure 19 demonstrates how we can apply this logic to obtain a quantitative result – the carbon activity is simply iterated upon until an inner surface damage of 0.5 is reached at 50 years. As shown in the figure this value is found to be 0.44, better than average performance, but still a very reasonable and feasible value. Recalling the range of performance shown in Figure 16, this result is step-change relative to simply assuming worst case performance.
Figure 20 shows the predicted resistance for a carbon activity of 0.44 as well as the damage equivalent operating point which is now just outside even minimum performance. This damage equivalent is simply the single partial pressure and temperature that gives back the same damage as the complete operating history, which is a very useful idea relative to best guesses which are necessarily conservative. The overall result is that the shift converter would be predicted to have very substantial remaining life – in this case 30 additional years of life!
This potential damage was investigated prior to this study. The vessel was replaced on an emergency basis due to the high sensitivity NDE results. Destructive examination was performed after the vessel was taken out of service and no damage was found, not even isolated voiding. This example demonstrates what a validated model may do when linked, even in a simple way, with traditional inspection. Our goal is to generate a substantial library of through-wall damage and property data on actual ex-service damaged equipment to provide more substantive evidence that the approach provides the predictive accuracy needed in management of HTHA-exposed equipment.
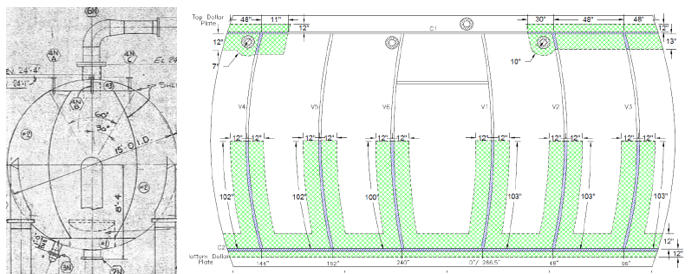
Figure 15 – High Temperature Shift Converter Evaluated
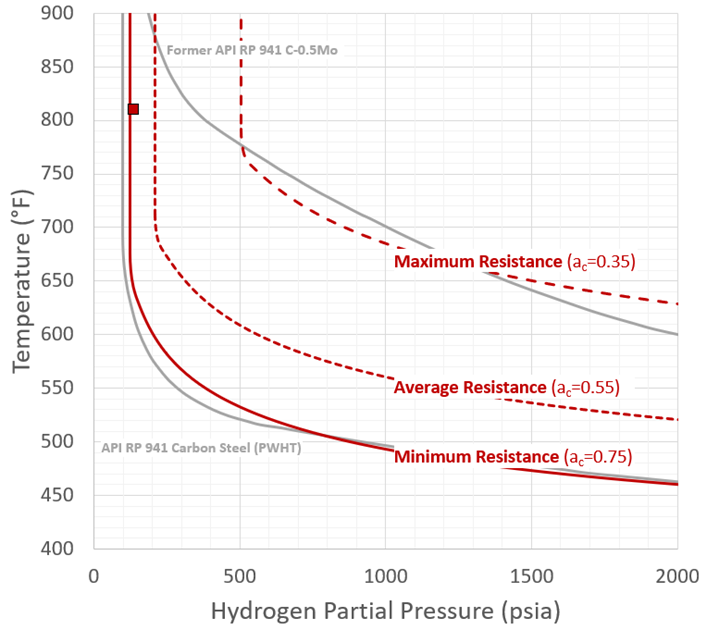
Figure 16 – Best Guess Operating Point and Nelson Curve Predictions
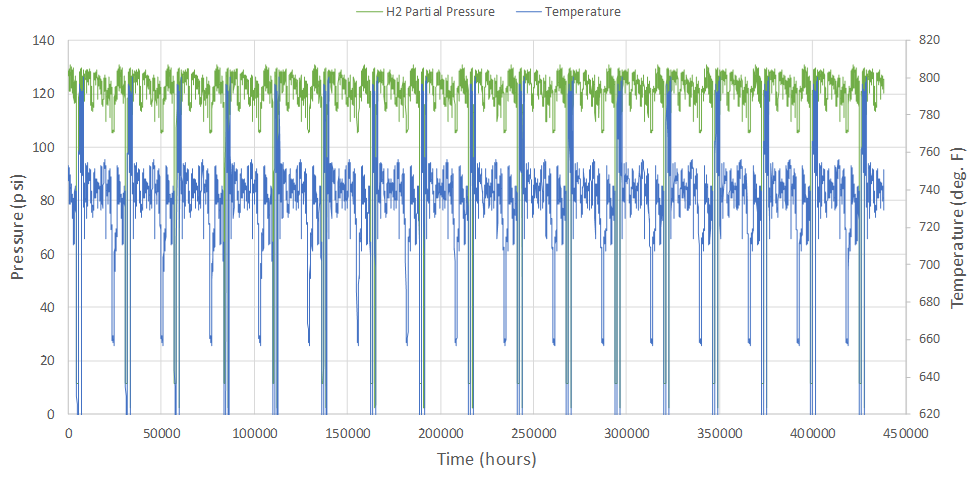
Figure 17 – Daily Operating Data for 3-Year Run (Repeated to 50 Years)

Figure 18 – Example of Correlation Between Damage Cross-Section and UT Scan Results
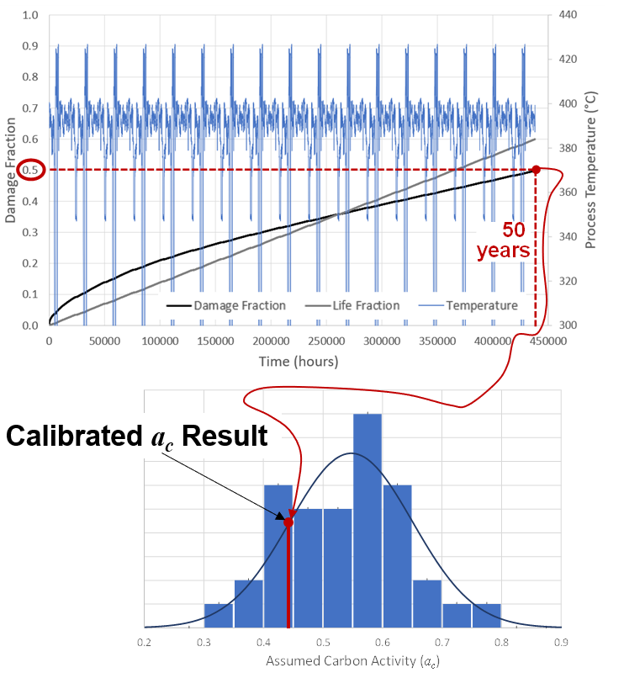
Figure 19 – High Temperature Shift Converter Carbon Activity Calibration
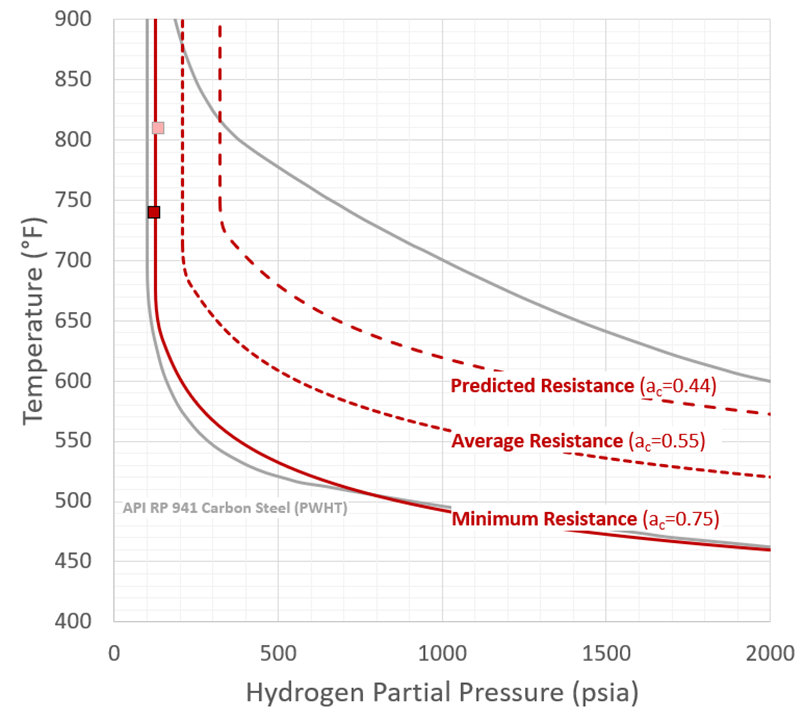
Figure 20 – Final Nelson Curve Evaluation Results
Time-Dependent Nelson Curves for Carbon and C-0.5Mo Steels
While the model linkage with inspection is an exciting prospect, the model can also be used to create validated time-based Nelson Curves right now. These curves do not have margin, but rather represent lower bound failure (loss of containment) just as the current API Nelson Curves do; an important point then is that a user-applied design or in-service margin should be incorporated when using these curves (for example, a 25°F downward shift which imposes a significant safety factor on life for inspection and component life cycle planning purposes).
Curves are generated for the PWHT and as-welded conditions, in both cases assuming failure by crack-like damage local to the weld using 100% of the most limiting allowable stress for a given material type (SA-516 Gr. 70 and SA-204 Gr. C).
Before presenting general carbon steel time-based Nelson Curves, 200,000-hour results for both PWHT and non-PWHT (as-welded) are compared to the existing API RP 941 curves. These are shown in Figure 21, where a typical carbon steel (SA-106 Gr. B) is used and the curves correspond to lower bound “failure” – as shown, the agreement is excellent.
This general agreement with existing practice for a reasonable time choice (200,000 hours) should give further confidence to the time-based results recommended here. The actual Carbon Steel time-based curves are shown in Figure 22 for the base metal or PWHT case and Figure 23 for the as-welded case. At shorter times, possible “C-curve” type behavior has been suppressed such that curves are not allowed to turn back at higher temperatures. Because there is a practical lower temperature limit at which HTHA can occur in practice, results below 400°F are shaded out. This value comes from discussion with members of the API RP 941 committee (API Subcommittee on Corrosion and Materials, or SCCM).
C-0.5Mo HTHA performance is well-known to be extremely variable. For this reason, both expected (or average) and minimum behavior are presented for both the PWHT and as-welded cases. Average and minimum have a statistical meaning here and correspond to ac values of 0.55 and 0.75, respectively, where 0.55 is the actual mean value of the industry cases analyzed and 0.75 bounds 97.5% of the data. C-curve behavior is also again suppressed. The results are shown in Figures 24-27.
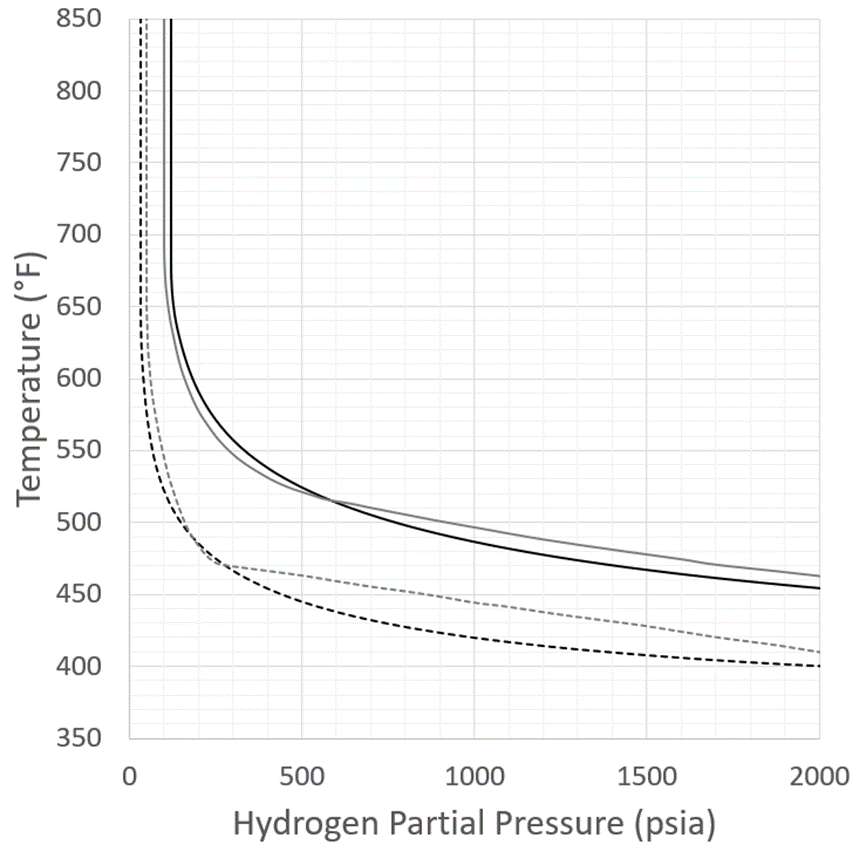
Figure 21 – Carbon Steel 200,000 Results Comparison with Current API RP 941
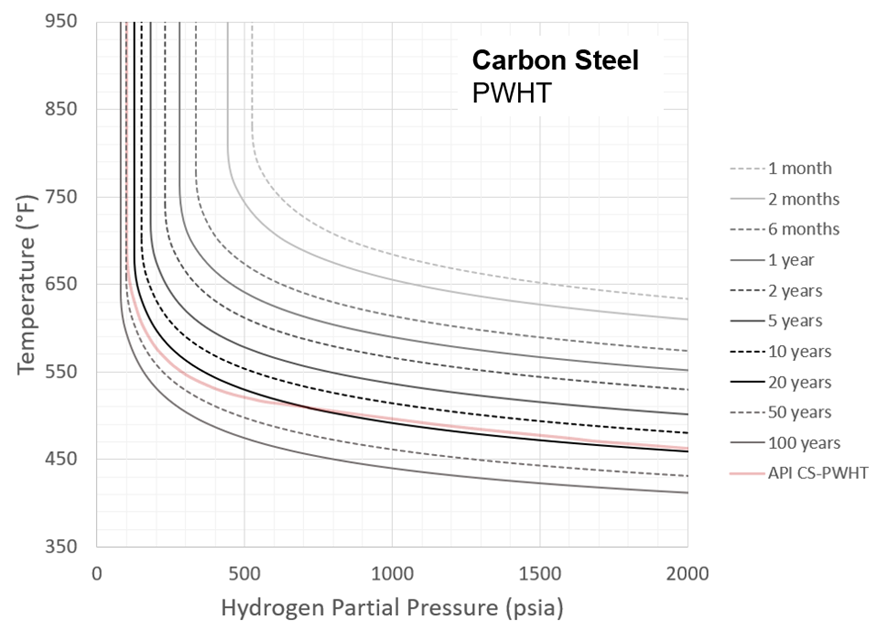
Figure 22 – Recommended Carbon Steel Nelson Curves: PWHT
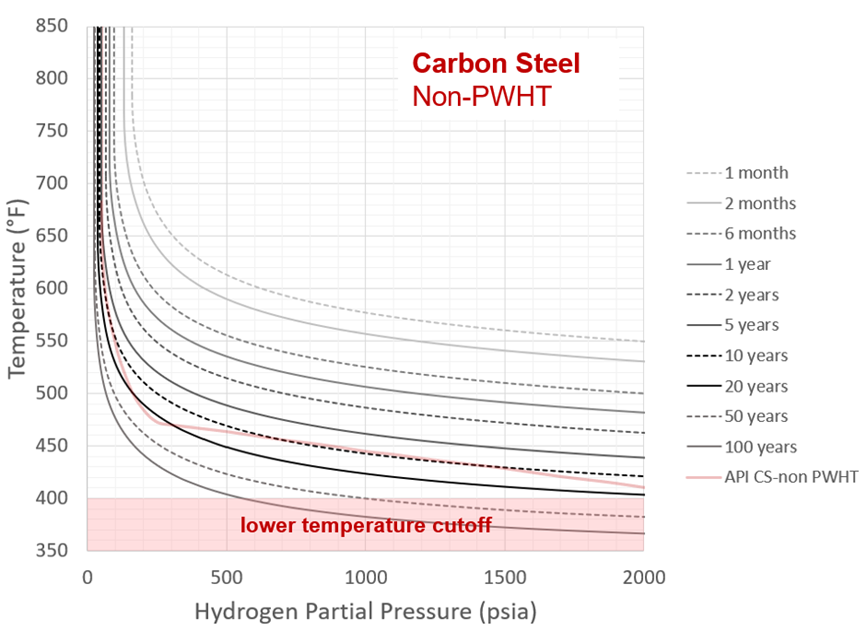
Figure 23 – Recommended Carbon Steel Nelson Curves: As-Welded
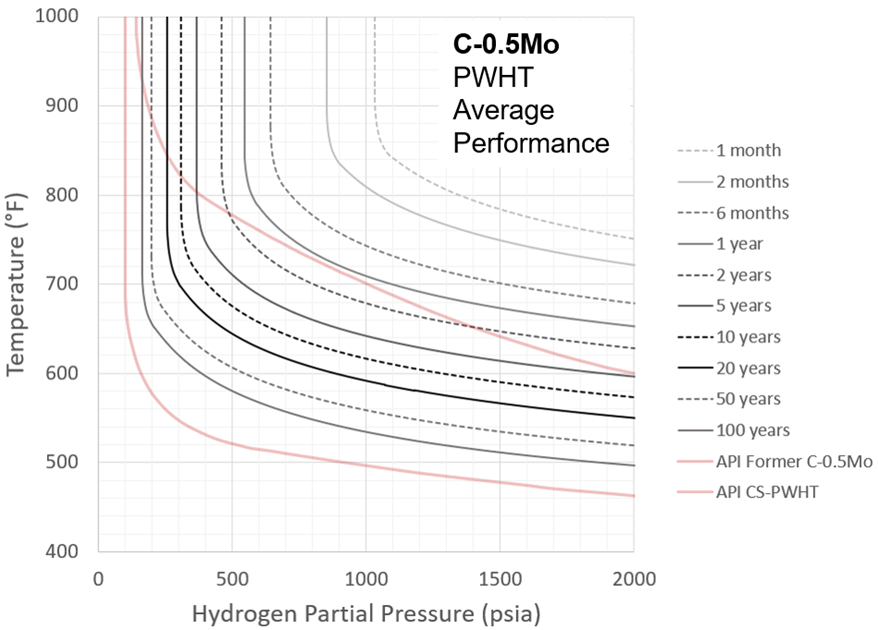
Figure 24 – Recommended C-0.5Mo Nelson Curves: PWHT, Average Performance
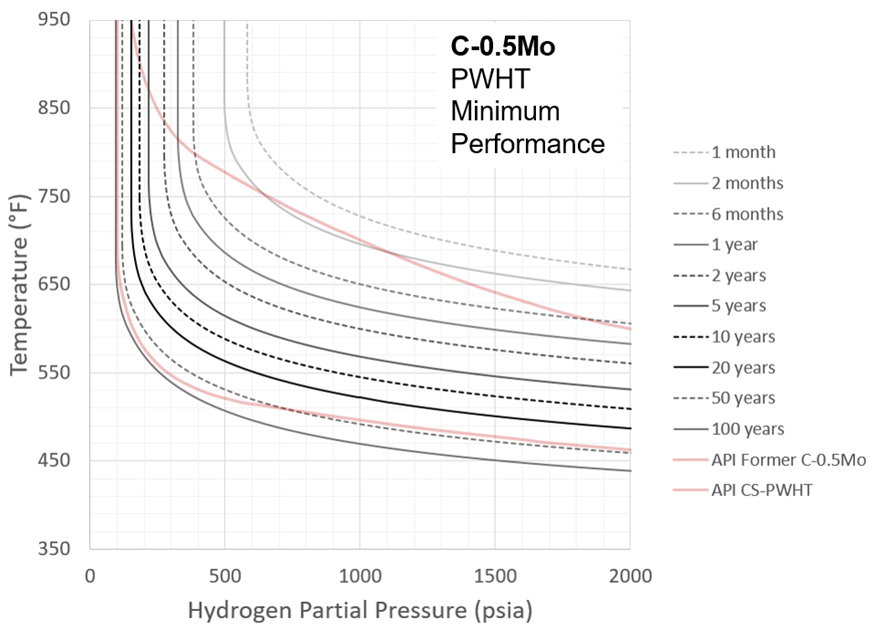
Figure 25 – Recommended C-0.5Mo Nelson Curves: PWHT, Minimum Performance
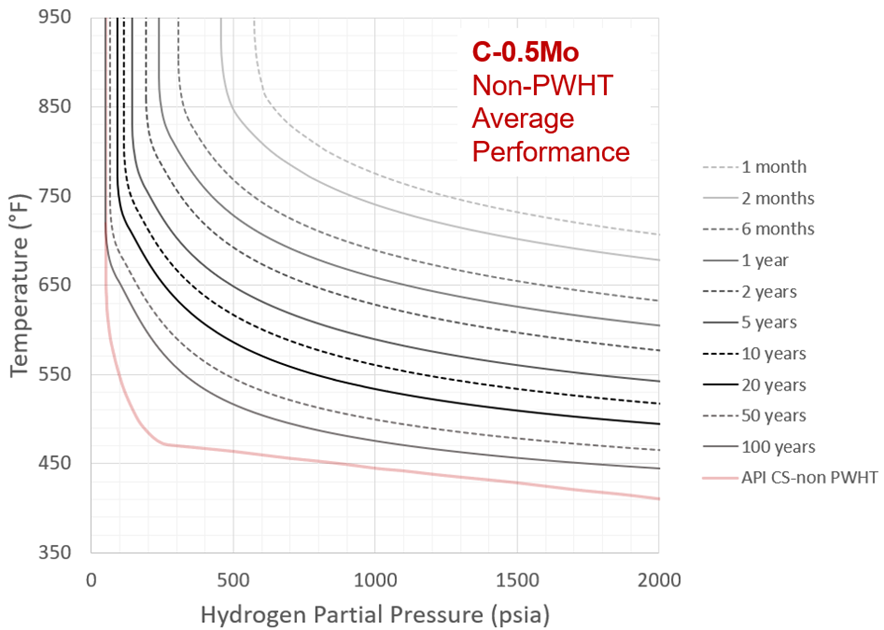
Figure 26 – Recommended C-0.5Mo Nelson Curves: As-Welded, Average Performance
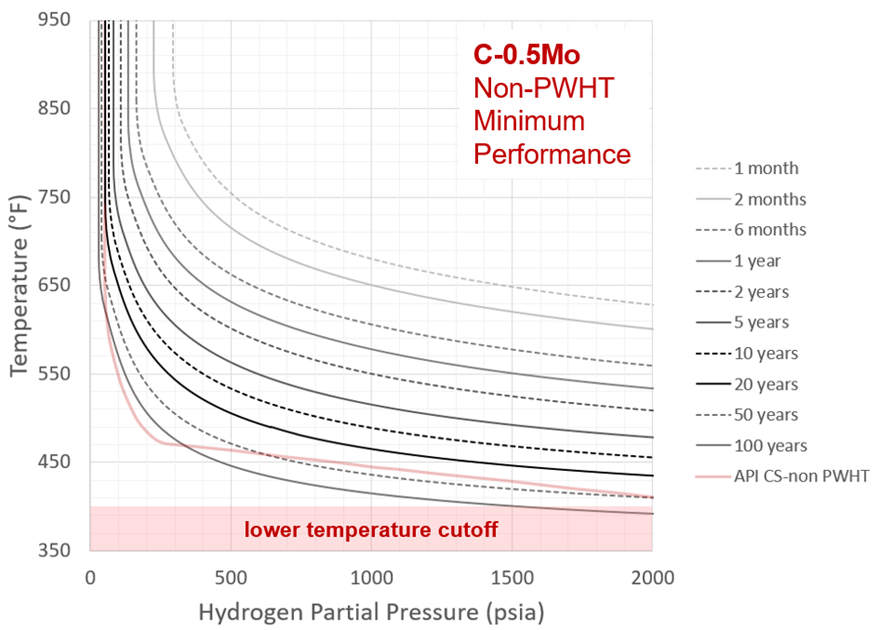
Figure 27 – Recommended C-0.5Mo Nelson Curves: As-Welded, Minimum Performance
Conclusion
This article describes HTHA predictive modeling advances that are designed to demonstrate a direct integration with inspection such that modeling and inspection can be leveraged together in a way never done before. To give confidence that the model can be utilized to provide safe and reliable predictions, validation through nearly 100 total case histories has been presented, the majority representing actual component long-term operation. In that sense, the calibration captures the variability in material processing, chemistry, fabrication details, weld quality, design, and operating variations inherent in the industry data itself.
To make the model results immediately accessible for a wide range of conditions, time-dependent Nelson Curves have also been presented. These curves are practical as lower bound inputs for both design and remaining life assessments and therefore are recommended for inclusion in API RP 941.
As part of our ongoing work, we hope to strengthen the property loss vs. damage correlation presented here, incorporating additional alloys, and further quantifying the integration with inspection.
Finally, note that the model presented in this article and introduced in is only part of the solution and should never be used in isolation from materials, inspection, and process expertise in addressing a given component [1]. Many of the critical considerations were given in and remain essential to a reliable and conservative estimate of performance, particularly given the potential consequences of failure of equipment in hydrogen service [11]. Indeed, risk is also a key part of the assessment.
With this in mind, it is hoped that the work described here can be part of a useful and impactful multidisciplinary solution to HTHA reliability issues that challenge industry and provide a step change in how components in HTHA service are managed.
References
- Dewees, D., Buchheim G., Staats, J., and Becht V, C., March/April 2020, “Practical HTHA Experience and Time-Based Nelson Curves for Improved Equipment Life Management,” Inspectioneering Journal.
- Recent Advances in Becht’s HTHA damage modeling approach Part 1
- Recent Advances in Becht’s HTHA damage modeling approach part-6 nucleation effects and cutoff pressures
- Recent Advances in Becht’s HTHA damage modeling approach Part-2 through wall damage modeling
- Recent Advances in Becht’s HTHA damage modeling approach Part-3 c-0.5Mo dataset and calibration
- Liu, P., 2001, “Fundamental Studies of Hydrogen Attack in C-0.5Mo Steel and Weldments Applied in Petroleum and Petrochemical Industries,” Department of Material Science and Engineering, The University of Tennessee (Doctoral Dissertation).
- API Recommended Practice 941, February 2016, “Steels for Hydrogen Service at Elevated Temperatures and Pressures in Petroleum Refineries and Petrochemical Plants,” Eighth Edition, The American Petroleum Institute.
- API Technical Report 941-A, June 2019, “The Technical Basis Document for API RP 941,” Addendum 1, The American Petroleum Institute.
- Weiner, L. C., 1961 “Kinetics and Mechanism of Hydrogen Attack of Steel,” Corrosion, V17, p. 109.
- Evans, T. C., 1948, “Hydrogen Attack on Carbon Steels,” Mechanical Engineering, 70(5), p. 414-416.
- Buchheim, G., November/December 2014, “A New Method for Prioritizing Equipment in HTHA Service for Inspection & Replacement and the Challenges in Obtaining Process Conditions to be Used in the HTHA Assessment,” Inspectioneering Journal.
Have questions for Becht HTHA experts? Contact Becht below:


